Normal weight insulin resistance is one of the most commonly missed metabolic conditions today — because most doctors never look beyond the bathroom scale.
The Blind Spot of “Normal Weight”
If weight alone determined metabolic health, millions of normal-weight individuals would not develop type 2 diabetes, fatty liver, or cardiometabolic disease.
Yet they do.
Some people with a “healthy BMI” accumulate liver fat.
Some develop elevated fasting insulin years before glucose rises.
Some experience cardiovascular events without ever being classified as overweight.
At the same time, others with a higher body weight show surprisingly stable metabolic markers.
So what is happening?
BMI is a population-level statistical tool.
It was never designed to diagnose metabolic dysfunction in individuals.
It measures mass relative to height.
It does not measure:
- Insulin dynamics
- Hepatic fat accumulation
- Lipid partitioning
- Inflammatory signaling
- Mitochondrial function
- Fuel flexibility
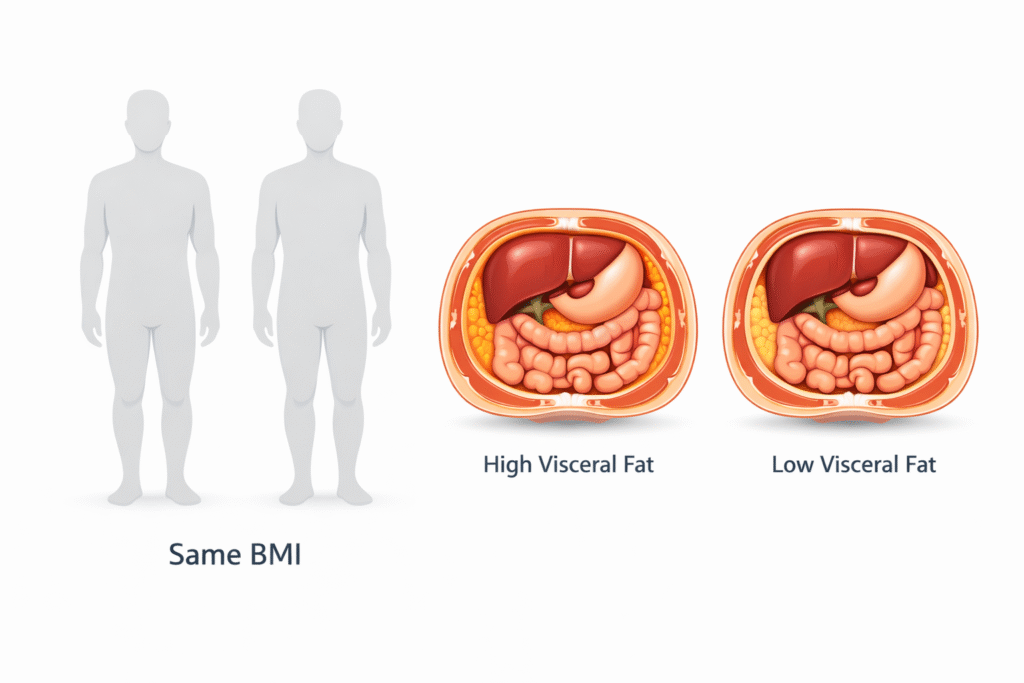
Two people can have the same BMI and completely different metabolic futures.
To understand risk, we must move beyond weight and examine fat distribution and metabolic signaling.
Why Visceral Fat Is Metabolically Disruptive
Visceral fat is not dangerous because it is fat.
It is dangerous because of:
- Where it drains
- What it secretes
- How it signals
We are not discussing aesthetics.
We are discussing organ-level metabolic biology.
1) Higher Lipolytic Activity — The Constant Free Fatty Acids (FFA) Leak
Visceral adipocytes are more catecholamine-sensitive and more resistant to insulin’s anti-lipolytic effect than subcutaneous fat.
That means:
- They release free fatty acids (FFAs) more readily
- They suppress lipolysis less effectively in response to insulin
- They “leak” energy even in the fasting state
This creates chronically elevated FFA exposure — especially to the liver.
2) The Portal Vein Effect — Liver First Exposure
This is the anatomical key.
Visceral fat drains directly into the portal vein → the liver.
The liver receives continuous fatty acid flux before the rest of the body.
Over time this promotes:
- Increased hepatic triglyceride synthesis
- Accumulation of intrahepatic fat
- Increased VLDL production
- Increased ApoB-containing particle export
This connects directly to:
- Elevated triglycerides
- Fatty liver (including lean NAFLD)
- Rising fasting insulin
BMI cannot detect any of this.
3) Hepatic Insulin Resistance — The Silent Phase
Chronic fatty acid exposure leads to accumulation of lipid intermediates such as diacylglycerol (DAG) in hepatocytes.
This activates PKCε and disrupts insulin receptor signaling.
The consequence:
The liver continues producing glucose despite insulin being present.
Fasting glucose may remain normal for years.
Fasting insulin rises quietly in compensation.
This is early metabolic dysfunction — often invisible on standard screening.
4) Ceramides and Lipotoxic Signaling
Excess FFA flux promotes ceramide synthesis and other bioactive lipid intermediates.
Ceramides:
- Impair GLUT4 translocation in skeletal muscle
- Disrupt mitochondrial efficiency
- Worsen systemic insulin resistance
Now we are not discussing weight.
We are discussing altered intracellular signaling across tissues.
5) Visceral Fat as an Endocrine Organ
Visceral adipose tissue secretes:
- TNF-α
- IL-6
- MCP-1
- Resistin
And produces lower adiponectin.
This shifts the internal environment toward:
- Chronic low-grade inflammation
- Reduced insulin sensitivity
- Endothelial dysfunction
Again — BMI cannot reflect inflammatory signaling.
6) Skeletal Muscle as a Metabolic Buffer
Muscle tissue acts as a major energy sink.
When muscle mass and mitochondrial capacity are adequate:
- Incoming glucose and fatty acids are oxidized efficiently
- Lipid intermediates do not accumulate
But when:
- Muscle mass declines
- Physical activity decreases
- Hyperinsulinemia persists
Energy is increasingly diverted toward visceral storage.
The issue is not fat itself.
The issue is impaired metabolic partitioning.
This is why resistance training improves metabolic health — not because it “burns calories,” but because it restores buffering capacity.
7) Cortisol and Central Fat Distribution
Visceral fat expresses higher glucocorticoid receptor density.
Chronic stress physiology favors central fat accumulation.
Two individuals with identical BMI can therefore have very different fat distribution and metabolic risk profiles.
How to Measure Visceral Risk Properly
If BMI is insufficient, what should we assess?
We focus on markers that reflect metabolic function — especially hepatic and insulin dynamics.
Waist-to-Height Ratio
A waist circumference greater than half of height suggests increased visceral burden.
Fasting Insulin
Often rises long before fasting glucose becomes abnormal.
Triglycerides (Contextualized with HDL)
Elevated triglycerides often reflect hepatic lipid overload and VLDL overproduction.
ALT and GGT
Mild elevations may indicate hepatic fat accumulation and metabolic stress — even in lean individuals.
Metabolic Flexibility
Difficulty switching between fuels (e.g., large post-meal glucose excursions, energy crashes) suggests impaired metabolic regulation.
What Actually Reduces Visceral Fat (Action Section)
The goal isn’t “weight loss.” The goal is to reduce the signals that drive visceral storage and hepatic overload—primarily chronically elevated insulin and impaired fuel switching.
Here are the highest-leverage actions:
1) Lower Insulin Demand (Without Starvation)
- Prioritize protein and nutrient density
- Reduce ultra-processed carbohydrate + industrial fat combinations
- Keep meals simpler and more metabolically predictable
This often reduces hunger naturally, which makes consistency possible.
2) Build Muscle to Improve Metabolic Buffering
Resistance training matters because muscle is a glucose and fat “sink.”
You’re improving partitioning—not chasing calories.
A simple target: 2–4 resistance sessions/week with progressive overload.
3) Walk Daily (Especially After Meals)
Walking is underrated because it lowers post-meal glucose and improves insulin sensitivity without stress hormones spiking. Even 10–15 minutes after meals can move the needle.
4) Protect Sleep and Stress Physiology
Visceral fat is strongly linked to stress physiology in many people. Poor sleep and chronic stress distort appetite, insulin signaling, and fat distribution.
If someone does everything “right” nutritionally but sleeps 5 hours, the body often fights back.
5) Track the Right Progress Markers
Don’t obsess over the scale. Track:
- Waist measurement
- Fasting insulin (when available)
- TG/HDL context
- ALT/GGT trends
- Energy, cravings, and post-meal stability
Visceral fat reduction often shows up in these signals before dramatic scale changes.
The Real Metric Is Metabolic Function
BMI measures mass.
It does not measure metabolic health.
Visceral fat reflects chronic metabolic signaling patterns — often driven by hyperinsulinemia, impaired flexibility, hepatic lipid overload, and reduced mitochondrial capacity.
Metabolic dysfunction can exist at any weight.
In the Fix Metabolic Chaos framework, we do not chase weight as the primary outcome.
We assess function first.
Because metabolic health is determined by signaling, partitioning, and organ-level physiology — not by the number on a scale.
People Also Ask
What is the difference between visceral fat and BMI?
BMI measures body weight relative to height, while visceral fat refers to fat stored around internal organs that directly affects metabolic health.
Can you have normal BMI and still have visceral fat?
Yes. Many normal-weight individuals accumulate visceral or liver fat and develop insulin resistance despite a healthy BMI.
What is a better indicator than BMI for metabolic health?
Waist-to-height ratio, fasting insulin, triglycerides, and liver enzymes often provide better insight into metabolic risk.
Author bio
Morteza Ariana is a Functional Nutrition Practitioner specializing in insulin resistance, type 2 diabetes, and systems-based metabolic restoration. His work focuses on identifying upstream drivers of metabolic dysfunction — including insulin load, liver–gut axis disruption, circadian misalignment, and micronutrient gaps — rather than masking symptoms.
He works with high-performing professionals through a structured 12-week Metabolic Restoration Blueprint designed to restore metabolic flexibility and long-term resilience.
If this resonates, the next step is clarity.
The Metabolic Restoration Blueprint is a structured 12-week framework designed to correct upstream metabolic drivers — not just manage symptoms.
Scientific References
Waist‐to‐height ratio is a better screening tool than waist circumference and BMI for adult cardio‐metabolic risk factors: systematic review and meta‐analysis (2012, Obesity Reviews, Ashwell et al.)
Visceral fat and metabolic inflammation: The portal theory revisited (Konrad; review PDF)
Impact of visceral adipose tissue on liver metabolism: Part I (2008, review)
Relationship Between Hepatic/Visceral Fat and Hepatic Insulin Resistance (2007, Gastroenterology, Gastaldelli et al.)
Diacylglycerol Activation of Protein Kinase Cε and Hepatic Insulin Resistance (2012, Cell Metabolism perspective, Jornayvaz & Shulman)
A Membrane-Bound Diacylglycerol Species Induces PKCε-Mediated Hepatic Insulin Resistance (2020; PubMed)
Visceral Adipose Tissue: The Hidden Culprit for Type 2 Diabetes (2024, review)
A causative link between visceral adiposity and hepatic insulin resistance (2005, AJP Endocrinology)
A high fasting plasma insulin concentration predicts type 2 diabetes (2000; PubMed)
Elevated fasting insulin predicts the future incidence of metabolic syndrome (2011; PMC full text)
TG/HDL Ratio: A marker for insulin resistance and cardiovascular risk (2021; PMC)
The Role of Ceramides in Insulin Resistance (2019, Frontiers in Endocrinology)