
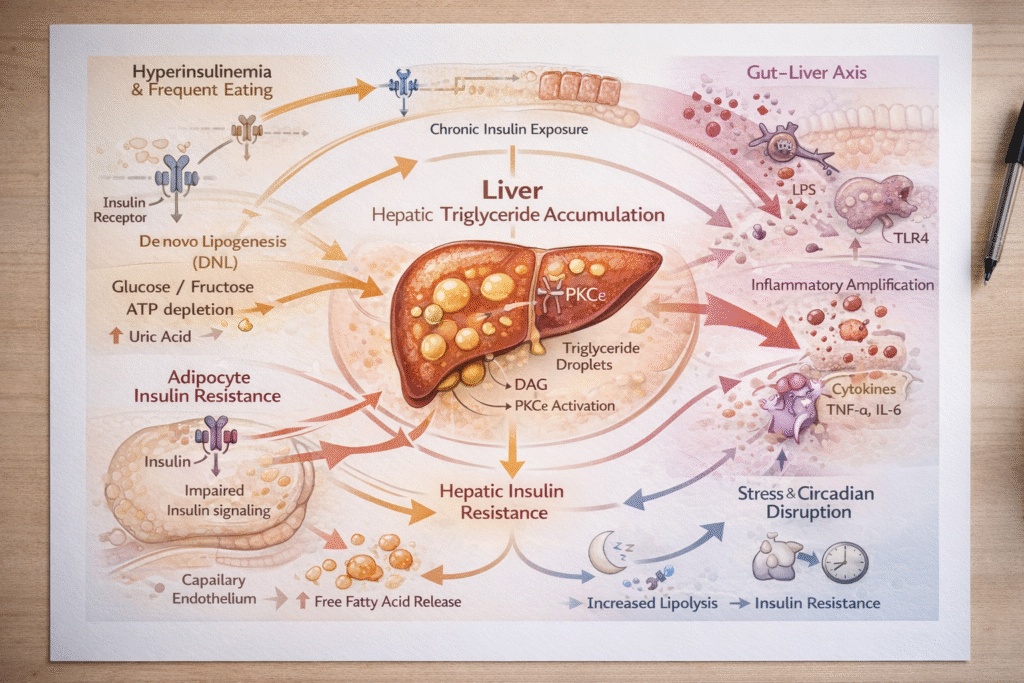
Figure: Integrated systems model of lean NAFLD showing adipocyte insulin resistance, chronic FFA spillover, de novo lipogenesis, inflammatory amplification, and hepatic DAG–PKCε–mediated insulin resistance.
Lean Fatty Liver Diseases Effect People who have never been Warned
Lean fatty liver disease affects people who have never been overweight, never been warned, and never been tested — because most doctors only look for fatty liver in obese patients. If your liver enzymes are elevated but your weight is normal, this article explains exactly what is happening and why.
Most people believe fatty liver is a disease of overweight individuals.
It isn’t.
You can have:
- A normal BMI
- Regular exercise
- “Normal” fasting glucose
- Acceptable cholesterol
And still accumulate fat inside your liver.
This phenotype is sometimes described as “Thin Outside, Fat Inside” (TOFI) or metabolically obese normal weight.
The scale can look fine.
The metabolism may not.
To understand the broader mechanism behind this process, see how insulin resistance drives fatty liver — the central pathway linking adipose dysfunction, hepatic fat accumulation, and metabolic disease.
Before the Biology: The Everyday Habits That Quietly Drive Fatty Liver
Before we go into the science, it helps to start with what typically happens in real life. Fatty liver usually doesn’t appear overnight. It develops when the liver is exposed—day after day—to more incoming energy than the body can use or safely store, especially in the context of high insulin and poor metabolic “downtime.”
Here are three common patterns that repeatedly show up in people with fatty liver:
1) Eating too often, with too little metabolic downtime
When we snack or eat frequently from morning to evening—especially carbohydrate-heavy foods—blood sugar and insulin stay elevated more often than they should. The liver keeps managing incoming fuel, refilling glycogen, and dealing with excess energy. Over time, this can increase pressure toward turning extra carbohydrate into fat (de novo lipogenesis). If the liver produces fat faster than it can burn it or export it, fat starts to accumulate inside the liver.
2) A diet built around ultra-processed foods (HFCS, refined carbs, industrial fats, junk food)
Many modern foods deliver a combination the body struggles with: rapidly absorbed sugars/starches, liquid calories, low satiety, and highly processed industrial seed oils. High fructose intake—especially in hypercaloric, ultra-processed diets—can increase liver fat production because fructose is handled largely by the liver. At the same time, ultra-processed diets can promote gut barrier disruption and low-grade inflammation in some people, which can amplify insulin resistance and worsen fatty liver progression. The key point is not a single ingredient—it’s the overall pattern of metabolic overload.
3) Chronic stress, disrupted circadian rhythm, and poor sleep
Sleep and circadian rhythm strongly influence insulin sensitivity. Poor sleep and circadian disruption can raise stress hormones, increase appetite and cravings, and worsen insulin resistance within days. Stress can also increase fat release from adipose tissue (free fatty acids) that then flow to the liver—adding more fuel to liver fat accumulation. For many people, fixing sleep is not “nice to have”—it’s a core lever for reversing fatty liver.
These real-life patterns set the stage. Next, we’ll explain the physiology—how adipose tissue dysfunction, fatty acid spillover, liver fat production, and inflammation interact to create insulin resistance and fatty liver even in people with normal weight.
Clinical Perspective: What I See in Practice
Lean fatty liver patients are often among the most surprised individuals who arrive in my practice. They have spent years believing that being thin automatically protected them from metabolic disease. Many do not identify themselves as metabolically unhealthy at all. They are not obese, they may wear the same clothing size they wore fifteen years earlier, and some consider themselves healthy eaters because they avoid visible fat and conventional calorie-dense foods.
Very often, the diagnosis was technically already present in previous imaging reports, but it was either minimized or never explained to them as a meaningful metabolic condition. Patients tell me with striking consistency: “My GP mentioned something about mild fatty liver but said not to worry.” Or: “They never even used the term NAFLD.” This is particularly common when liver enzymes are still inside the reference range or only mildly elevated. In conventional settings, significant attention is rarely given to fatty liver unless the disease has progressed far enough to produce obvious pathology — by which point the most reversible window has typically passed.
The emotional reaction in the consultation is usually a mixture of confusion and shock. They genuinely believed that because they were lean, they were metabolically safe. Many have internalized the cultural message that only overweight individuals develop insulin resistance, fatty liver, or metabolic syndrome. When they realize that hepatic fat accumulation can operate independently of BMI, it fundamentally changes how they understand chronic disease.
The pattern I uncover most consistently in these patients is not excessive caloric intake in the traditional sense. It is chronic exposure to metabolically disruptive modern eating patterns: ultra-processed foods, frequent eating throughout the day, excessive refined carbohydrate intake, chronic snacking, sugar-sweetened beverages, and — perhaps most underestimated of all — high-fructose corn syrup and concentrated fructose exposure. The dietary signature of the lean fatty liver patient is rarely what conventional advice would flag as problematic. It is the opposite.
Many lean fatty liver patients are actually low-fat eaters in the conventional sense. They avoid butter, eggs, and red meat. They consume large amounts of processed grain products, fruit juices, breakfast cereals, energy bars, sweetened yogurt, and so-called heart-healthy packaged foods. Mechanistically, this dietary pattern turns the liver into the metabolic processing center for chronic carbohydrate and fructose overload — the exact substrate environment that drives hepatic de novo lipogenesis. The patient believes they are eating well. The biology disagrees.
One anonymized case illustrates the pattern. A lean middle-aged patient with a completely normal BMI arrived primarily because of fatigue, afternoon energy crashes, poor concentration, and mild elevations in triglycerides that had been dismissed for years. Their fasting glucose was still technically normal. Their HbA1c was only mildly elevated. Their liver enzymes were either normal or borderline. Because the patient was slim, neither they nor their physicians had considered fatty liver a likely possibility. Further assessment revealed clear hepatic fat accumulation alongside evidence of significant insulin resistance physiology — fasting insulin elevated, TG/HDL ratio above the functional concern threshold, HOMA-IR well above optimal, and clear evidence of adipose-driven fatty acid flux reaching the liver
What changed profoundly for this patient was not simply the diagnosis. It was the realization that body weight alone is an extremely poor marker for metabolic health. For years they had operated by an internalized rule: I am thin, therefore I am healthy. Once they understood the underlying physiology — that chronic hyperinsulinemia, hepatic fat accumulation, and metabolic dysfunction can occur long before obesity becomes visible — the entire picture suddenly became coherent.
The fatigue, the energy instability, the cravings, the elevated triglycerides, the worsening recovery after meals, the subtle cognitive symptoms — they were no longer random isolated complaints. They were manifestations of the same underlying metabolic process operating across organs. That moment is often psychologically important. It is the point at which patients stop viewing health exclusively through the lens of body size and begin understanding metabolism as a dynamic physiological system rather than a cosmetic appearance.
What Fatty Liver Actually Is (NAFLD vs MASLD)
Traditionally called Non-Alcoholic Fatty Liver Disease, the condition is now more accurately termed Metabolic Dysfunction–Associated Steatotic Liver Disease.
That name change matters.
Because the root issue is not weight.
It is metabolic dysfunction.
Steatosis begins when triglycerides accumulate inside hepatocytes beyond physiologic levels (~5% of liver weight). But triglyceride itself is not the real problem.
The problem is what accompanies it: disrupted insulin signaling.
Important Clinical Safeguard
Before labeling fatty liver as metabolic, proper evaluation should exclude:
- Alcohol-related liver disease
- Viral hepatitis
- Medication-induced steatosis
- Iron overload or rarer liver disorders
Lean does not automatically mean metabolic — but metabolic dysfunction in lean individuals is far more common than most clinicians recognize.
The Process Often Starts in Adipose Tissue — Not the Liver
Healthy adipose tissue acts as a metabolic buffer. In the normal state, insulin effectively suppresses lipolysis, hormone-sensitive lipase (HSL) is inhibited, and free fatty acids remain stored where they belong — inside the adipocyte. Fat stays safely in fat tissue, available for release when energy is genuinely needed.
In adipocyte insulin resistance, this regulatory control breaks down. Insulin no longer effectively suppresses lipolysis. Hormone-sensitive lipase remains active even when it should not be. Free fatty acids continuously leak into circulation regardless of insulin signaling. This chronic free fatty acid spillover becomes a major fuel source delivered directly to the liver through the portal vein — even during fasting periods when adipose tissue should be releasing nothing.
Human tracer studies have quantified the contributions of different fat sources to hepatic triglyceride accumulation in fatty liver. Approximately 60% of hepatic triglyceride originates from circulating free fatty acids — primarily adipose-derived. Approximately 25% comes from de novo lipogenesis, where the liver converts excess carbohydrate into fat. Approximately 15% comes from dietary fat absorbed directly from food.
The implication is precise. Adipose dysfunction is often the dominant driver of hepatic fat accumulation. The liver is frequently the victim — not the origin. When adipose tissue becomes insulin resistant, fatty acids escape their proper storage site and begin driving fat accumulation and metabolic dysfunction inside the liver. This is the upstream mechanism that the lean fatty liver patient is rarely told about, because their normal BMI signals to standard screening that the relevant adipose dysfunction cannot be present.
The Liver’s Contribution: De Novo Lipogenesis
When energy intake exceeds disposal capacity, the liver converts excess carbohydrate into fat through de novo lipogenesis. This pathway is normally tightly regulated. In the metabolic environment of chronic hyperinsulinemia, refined carbohydrate overload, and continuous eating, the regulatory controls are progressively bypassed.
Fructose deserves specific mechanistic attention here because it operates differently from glucose. Fructose enters hepatocytes largely independent of insulin. It is phosphorylated by fructokinase, an enzyme without the feedback inhibition that limits glucose phosphorylation by glucokinase. This means fructose bypasses phosphofructokinase — the main glycolytic control point that prevents excessive substrate flow toward fat synthesis. The result is unrestricted substrate delivery to hepatic lipogenic pathways, generating glycerol-3-phosphate and acetyl-CoA, both required for triglyceride synthesis. Additionally, rapid fructose phosphorylation can transiently lower intracellular ATP and increase uric acid production, contributing to oxidative and mitochondrial stress in susceptible individuals.
But liver fat accumulation is not only about fat production; it is also about fat export. Choline deficiency can impair VLDL export, making it harder for the liver to package and remove triglycerides efficiently.
An important clinical nuance is worth naming directly: fructose alone is not inherently toxic. The metabolic harm arises in the context of energy surplus, hyperinsulinemia, low muscle glucose disposal, poor sleep, and visceral adiposity. It is the context that determines the outcome. In metabolically healthy, physically active individuals with adequate energy balance, fructose consumption is far less likely to drive steatosis. In metabolically vulnerable individuals — and the lean fatty liver patient is often more metabolically vulnerable than they appear — fructose amplifies existing substrate overload and accelerates hepatic fat accumulation through pathways that the conventional dietary framework does not flag.
Why Liver Fat Impairs Insulin Signaling
Triglyceride accumulation itself is relatively inert.
But lipid intermediates — especially diacylglycerol (DAG) — are not.
DAG activates PKCε inside hepatocytes, which interferes with insulin receptor signaling.
The result:
The liver continues producing glucose even when insulin is present.
This is hepatic insulin resistance.
Fasting glucose can remain “normal” for years.
Fasting insulin quietly rises.
Metabolic dysfunction begins long before diabetes appears. This is why NAFLD and type 2 diabetes are biologically connected long before fasting glucose crosses the diagnostic threshold.
The Gut–Liver Axis: An Amplifier, Not the Root Cause
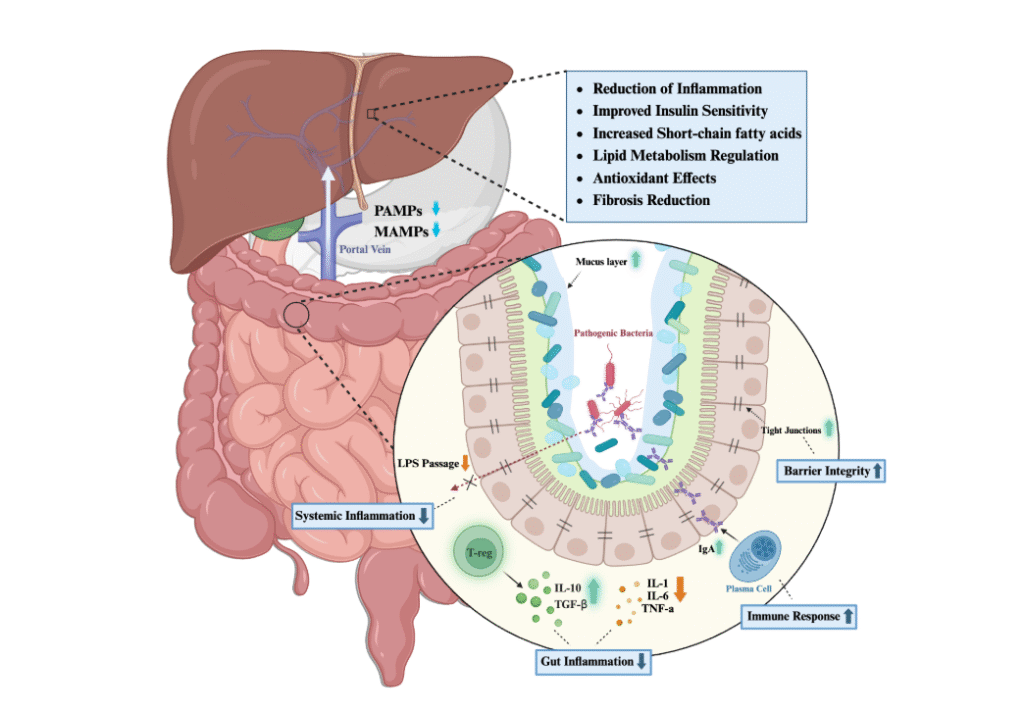
The liver does not operate in isolation.
In some individuals, increased intestinal permeability allows higher amounts of lipopolysaccharide (LPS) — a component of Gram-negative bacterial cell walls — to enter circulation.
This phenomenon is sometimes referred to as metabolic endotoxemia.
What LPS Does in the Liver
When lipopolysaccharide reaches the liver through the portal vein, it binds to TLR4 receptors particularly expressed on Kupffer cells — the liver’s resident macrophages. This binding activates inflammatory signaling pathways including NF-κB.
The downstream consequences are coherent and cumulative. The liver increases production of inflammatory cytokines including TNF-α and IL-6. Oxidative stress rises. Insulin receptor signaling becomes impaired through the same JNK and IKK-β kinase pathways covered in detail in the post on chronic low-grade inflammation — kinases that phosphorylate insulin receptor substrate-1 on serine residues, blocking the normal tyrosine phosphorylation that allows insulin signaling to proceed. Vulnerability to fat accumulation increases as the inflammatory environment compounds the existing metabolic stress.
It is important to be precise about what this means. Inflammation does not usually create fatty liver on its own. But it can significantly worsen insulin resistance and accelerate the progression from simple steatosis toward steatohepatitis. The gut-liver axis is therefore an amplifier of the underlying adipose-and-hepatic dysfunction rather than the root cause of it.
Why This Matters in Lean Individuals
A lean person may not appear metabolically unhealthy. But if adipose tissue dysfunction is already present and FFA spillover is feeding the liver, inflammatory amplification can push the system further toward insulin resistance.
In this context:
Adipose dysfunction provides the substrate load.
Hepatic lipid signaling disrupts insulin action.
Gut-derived inflammation increases susceptibility and progression.
This is why fatty liver is best understood as a systems disorder — involving adipose tissue, liver metabolism, and immune signaling.
Why Lean Individuals Are Vulnerable
The lean fatty liver phenotype is not a contradiction. It is the predictable result of specific physiological vulnerabilities that operate independently of overall body weight.
Visceral fat dominance is the first vulnerability. A normal BMI does not exclude elevated waist circumference, and visceral fat is metabolically different from subcutaneous fat — releasing free fatty acids directly into portal circulation and producing inflammatory adipokines that travel straight to the liver. A lean person with central adiposity is metabolically more similar to an overweight person than to a lean person with peripheral fat distribution.
Limited subcutaneous fat expandability compounds this. Subcutaneous adipose tissue serves as a metabolic buffer — it absorbs excess energy and stores it safely. When subcutaneous storage capacity is exceeded, fat overflows into ectopic sites: the liver, the pancreas, the heart, the visceral compartment. Some people have constitutionally lower subcutaneous storage capacity and therefore reach the spillover threshold at a lower body weight than others.
Low muscle mass reduces glucose disposal. Skeletal muscle is the largest single site of insulin-mediated glucose uptake in the body. A lean person with low muscle mass — through aging, sedentary lifestyle, or undernutrition — has reduced capacity to handle dietary carbohydrate, increasing hepatic substrate burden and pushing more energy toward fat synthesis.
Chronic hyperinsulinemia drives the system forward. Even in a lean patient, repeated insulin spikes from frequent eating and refined carbohydrate consumption promote de novo lipogenesis while inhibiting fat oxidation. The liver becomes a net fat-producer rather than a net fat-burner regardless of total caloric intake.
Sleep disruption and chronic stress complete the picture. Elevated cortisol increases lipolysis from adipose tissue, delivering more free fatty acids to the liver. Sleep deprivation directly impairs insulin sensitivity within days. These drivers operate independently of diet and weight, which is why a thin patient with good nutrition can still develop fatty liver if their sleep and stress profile is chronically disrupted.
This is ectopic fat deposition operating in a body that does not look like it should be susceptible. The vulnerability is structural, not behavioral.
Can Liver Enzymes Be Normal?
Yes.
ALT and AST can remain within laboratory reference ranges even with significant steatosis.
GGT may reflect oxidative stress but is not definitive.
Normal enzymes do not exclude fatty liver.
Detecting Lean Fatty Liver Early
Liver enzymes alone are insufficient for detecting lean fatty liver. A more comprehensive set of markers, read together, captures the dysfunction that standard screening misses.
The most informative markers in this context are waist-to-height ratio (above 0.5 is a functional concern threshold regardless of BMI), fasting insulin, HOMA-IR calculated from fasting insulin and fasting glucose, the triglyceride-to-HDL ratio, and the magnitude of post-meal glucose excursions where this can be measured with a continuous glucose monitor.
Imaging adds direct anatomical assessment. Standard ultrasound has moderate sensitivity for hepatic steatosis — it will detect significant fat accumulation but can miss earlier stages. MRI-PDFF (proton density fat fraction) provides quantitative assessment of hepatic fat content and is the most accurate non-invasive imaging method currently available. For most patients, ultrasound is the appropriate first step; MRI-PDFF is reserved for cases where more precise quantification is needed.
Fibrosis screening becomes relevant once steatosis is confirmed. Validated tools including the FIB-4 index and the NAFLD Fibrosis Score use standard blood markers to estimate fibrosis risk and guide whether further hepatology evaluation is needed.
A practical clinical point worth emphasizing: steatosis often improves rapidly with metabolic correction. Fibrosis reversal is slower and stage-dependent. This is why catching the dysfunction at the steatosis stage — when liver enzymes may still be normal — is the most reversible window. Waiting for enzyme elevation or imaging-confirmed advanced disease typically means missing the easiest opportunity for complete recovery.
The Systems Model (Complete Loop)
Adipocyte insulin resistance
→ FFA spillover
→ hepatic fat accumulation
- hepatic DNL contribution
→ lipid intermediates (DAG)
→ impaired insulin signaling
→ compensatory hyperinsulinemia
→ inflammatory amplification (LPS/TLR4)
→ metabolic progression
This is not a weight problem.
It is a signaling problem.
A Note on Uncertainty
The clinical framework presented in this article — that lean fatty liver develops from a coherent biological cascade of adipocyte insulin resistance, free fatty acid spillover, hepatic de novo lipogenesis, and gut-liver axis amplification — reflects the convergence of mechanistic research and clinical observation in functional metabolic medicine. The underlying biology is well-established in the research literature, particularly through the tracer studies that have quantified the contribution of each source to hepatic triglyceride accumulation.
What is less precisely quantified at the individual level is which driver dominates in any given patient. Some lean fatty liver patients are primarily adipose-driven — their visceral compartment is dysfunctional, FFA spillover is the main contributor, and the dietary lever is secondary. Others are primarily diet-driven — their adipose tissue is intact but chronic fructose and refined carbohydrate exposure overwhelms hepatic processing capacity through de novo lipogenesis. Most are some combination of both, with the proportions varying by individual genetics, dietary history, body composition, sleep quality, and stress exposure.
The functional thresholds used in this article — waist-to-height above 0.5, TG/HDL ratio above 2.0 in mg/dL units, fasting insulin above 10 µIU/mL, HOMA-IR above 1.8 — reflect the values at which clinical observation and the broader research literature suggest metabolic dysfunction is operating. They are not codified in conventional hepatology or endocrinology guidelines, which continue to use more permissive thresholds derived from population averages rather than from optimal physiology. The choice of which framework to apply depends on what clinical question is being asked. For identifying lean fatty liver during the reversible window — before structural damage and before conventional markers cross diagnostic thresholds — the functional framework is substantially more useful.
Individual variability is real. A single elevated marker in isolation is a signal to investigate further, not a diagnosis. The trajectory across multiple panels over time, read alongside the clinical phenotype and the dietary and lifestyle history, always carries more weight than any single value at any single time point. The framework presented here has been clinically reliable across many patients in functional medicine practice. It is not the only valid approach. It is the approach that catches the dysfunction at the stage when reversal is still most achievable.
How to Prevent and Reverse Fatty Liver (Plain Language, Realistic Steps)
The encouraging truth is that fatty liver is often reversible—especially in earlier stages. The goal is not perfection. The goal is to reduce the daily metabolic load on the liver and restore insulin sensitivity.
1) Create metabolic “downtime” between meals
For many people, the simplest first step is reducing constant eating. Fewer eating occasions (without forcing extreme restriction) can lower insulin exposure and give the liver time to clear stored fat. This can be done by tightening the eating window, removing snacks, and building meals that actually satisfy.
2) Remove the highest-impact drivers: sugar drinks, ultra-processed foods, and “fructose + surplus”
If someone has fatty liver, liquid sugars and ultra-processed snacks are usually the fastest path to ongoing liver fat production. Reducing these has an outsized effect because it lowers the liver’s fuel burden and improves satiety. Focus on real, minimally processed food that keeps appetite stable and supports muscle.
3) Prioritize protein and rebuild muscle
Muscle is a major “sink” for glucose. More muscle and better muscle function means better glucose disposal and less overflow to the liver. Resistance training—done consistently—often improves insulin sensitivity even before weight changes.
4) Fix sleep and circadian rhythm like it’s a treatment (because it is)
Aim for stable sleep and wake times, morning light exposure, and reduced late-night eating. Even modest sleep improvement can improve insulin resistance and appetite regulation. If sleep is poor, many nutrition strategies won’t work as well.
5) Address stress and recovery
Chronic stress can keep the body in a state where it releases more fatty acids into the blood and worsens insulin resistance. This doesn’t require “perfect calm.” It requires daily recovery inputs: walking, breathwork, time outdoors, strength training with adequate rest, and reducing evening stimulation.
6) Track the right markers, not only liver enzymes
ALT can be normal even when fatty liver exists. To monitor improvement, it often helps to follow fasting insulin, triglycerides/HDL ratio, waist circumference (or waist-to-height), and—when possible—imaging. If fibrosis risk is a concern, validated tools like FIB-4 can help guide next steps.
The core message is simple: fatty liver improves when the liver is no longer forced to handle constant excess fuel—and when insulin sensitivity is restored through better meal structure, better food quality, better sleep, and stronger muscle.
Final Thought
If you are lean but experience:
- Rising fasting insulin
- Post-meal crashes
- Central fat accumulation
- Elevated triglycerides
- Fatigue despite normal labs
Do not dismiss it.
Metabolic dysfunction begins internally — long before the scale changes.
Lean does not equal protected.
This is often the stage where patients are told ‘everything is normal’ — even though early insulin resistance is already disrupting their metabolism beneath the surface.
People Also Ask
Can you have fatty liver if you are not overweight?
Yes. Fatty liver is driven by metabolic dysfunction, not body weight alone. A person can have a normal BMI but still have visceral fat, adipose tissue insulin resistance, and liver fat accumulation. This is sometimes called “lean NAFLD” or “metabolically obese normal weight.”
If my ALT is normal, can I still have fatty liver?
Yes. Many individuals with fatty liver have normal ALT and AST levels. Liver enzymes are not sensitive enough to rule out early steatosis. Imaging and metabolic markers such as fasting insulin, triglycerides, and waist circumference often provide better insight.
What is the main cause of fatty liver?
In most cases, fatty liver develops when the liver is repeatedly exposed to excess fuel — especially in the context of hyperinsulinemia and adipocyte insulin resistance. Chronic free fatty acid spillover from adipose tissue and increased liver fat production (de novo lipogenesis) are major contributors.
Is fructose the main cause of fatty liver?
Fructose is not inherently toxic. However, in the setting of energy surplus, hyperinsulinemia, and low metabolic flexibility, high fructose intake can increase liver fat production. Context matters more than a single nutrient.
How does stress and poor sleep affect fatty liver?
Sleep deprivation and chronic stress can worsen insulin resistance within days. They increase stress hormones, alter appetite regulation, and can increase fatty acid release from adipose tissue — all of which may contribute to liver fat accumulation.
Can fatty liver be reversed?
In many cases, yes — especially in early stages. Improving insulin sensitivity, reducing constant energy overload, rebuilding muscle mass, improving sleep, and restoring metabolic flexibility can significantly reduce liver fat. Fibrosis reversal is slower and depends on stage.
What is the connection between insulin resistance and fatty liver?
Fatty liver and insulin resistance reinforce each other. Adipocyte insulin resistance increases fatty acid flow to the liver. Liver fat then impairs hepatic insulin signaling (via DAG–PKCε mechanisms), leading to further metabolic dysfunction. It is a feed-forward loop.
How can I know if I am at risk even if I feel “normal”?
Feeling normal is not the same as being metabolically healthy. The lean fatty liver patient frequently presents without any single dramatic symptom — and that is precisely what allows the dysfunction to remain undetected for years.
The early warning signs worth taking seriously, particularly when they appear together, include: rising fasting insulin even when fasting glucose remains in the conventional normal range, a triglyceride-to-HDL ratio above 2.0 in mg/dL units, mildly elevated ALT or GGT that has been described as “borderline” or “nothing to worry about,” waist circumference above 94 cm in men or 80 cm in women regardless of overall body weight, post-meal energy crashes within one to two hours of eating, persistent cravings for sugar or refined carbohydrate, slow recovery after physical effort, mild but persistent fatigue, and family history of type 2 diabetes or fatty liver in first-degree relatives.
No single one of these is diagnostic. Several of them appearing together — particularly in a lean person with central adiposity and a conventionally healthy lifestyle on paper — is the clinical signature of compensatory metabolic dysfunction operating beneath an apparently normal exterior. The appropriate next step is comprehensive metabolic assessment that goes beyond fasting glucose and HbA1c: fasting insulin, HOMA-IR, the full lipid panel with calculated TG/HDL ratio, liver enzymes interpreted against functional thresholds, hsCRP, and where possible imaging of the liver. The information return on this assessment is substantial. The cost is modest. The standard panel will rarely flag what is actually happening.
About the Author
Morteza Ariana is a State-Certified Functional Nutritionist based in Germany, specializing in insulin resistance, type 2 diabetes, and root-cause metabolic restoration. He holds advanced training in systems-based physiology and has worked with patients across the U.S. and Europe for over 10 years.
His clinical framework is built around a core principle that mainstream medicine consistently overlooks: chronically elevated insulin — not blood glucose — is the earliest and most actionable driver of metabolic disease. That conviction was shaped in part by his own experience with hyperinsulinemia in 2016, and deepened through a decade of clinical practice and the study of leading researchers in metabolic medicine including Benjamin Bikman, Joseph Kraft, Gerald Reaven, Jason Fung, and Stephen Phinney.
His work focuses on identifying and correcting the upstream metabolic signals — insulin load, liver-gut axis dysfunction, circadian misalignment, and micronutrient gaps — that standard screening misses entirely. Patient outcomes are documented, anonymized, and published on this site.
If this resonates, the next step is clarity
The Metabolic Restoration Blueprint is a structured 12-week framework designed to correct upstream metabolic drivers — not just manage symptoms.
Scientific References
1. Donnelly KL, Smith CI, Schwarzenberg SJ, et al. Sources of fatty acids stored in liver and secreted via lipoproteins in patients with nonalcoholic fatty liver disease. Journal of Clinical Investigation. 2005;115(5):1343–1351. 🔗 https://pubmed.ncbi.nlm.nih.gov/15864352/
2. Jornayvaz FR, Shulman GI. Diacylglycerol activation of protein kinase Cε and hepatic insulin resistance. Cell Metabolism. 2012;15(5):574–584. 🔗 https://pubmed.ncbi.nlm.nih.gov/22560219/
3. Samuel VT, Shulman GI. The pathogenesis of insulin resistance: integrating signaling pathways and substrate flux. Journal of Clinical Investigation. 2016;126(1):12–22. 🔗 https://pubmed.ncbi.nlm.nih.gov/26727229/
4. Lim JS, Mietus-Snyder M, Valente A, Schwarz JM, Lustig RH. The role of fructose in the pathogenesis of NAFLD and the metabolic syndrome. Nature Reviews Gastroenterology and Hepatology. 2010;7(5):251–264. 🔗 https://pubmed.ncbi.nlm.nih.gov/20368739/
5. Stanhope KL, Schwarz JM, Keim NL, et al. Consuming fructose-sweetened, not glucose-sweetened, beverages increases visceral adiposity and lipids and decreases insulin sensitivity in overweight/obese humans. Journal of Clinical Investigation. 2009;119(5):1322–1334. 🔗 https://pubmed.ncbi.nlm.nih.gov/19381015/
6. Younossi ZM, Stepanova M, Negro F, et al. Nonalcoholic fatty liver disease in lean individuals in the United States. Medicine. 2012;91(6):319–327. 🔗 https://pubmed.ncbi.nlm.nih.gov/23117851/
7. Ma X, Liu S, Zhang J, et al. Proportion of NAFLD patients with normal ALT value in overall NAFLD patients: a systematic review and meta-analysis. BMC Gastroenterology. 2020;20(1):10. 🔗 https://pubmed.ncbi.nlm.nih.gov/31931727/
8. Cani PD, Amar J, Iglesias MA, et al. Metabolic endotoxemia initiates obesity and insulin resistance. Diabetes. 2007;56(7):1761–1772. 🔗 https://pubmed.ncbi.nlm.nih.gov/17456850/
9. Stefan N, Häring HU, Hu FB, Schulze MB. Metabolically healthy obesity: epidemiology, mechanisms, and clinical implications. The Lancet Diabetes & Endocrinology. 2013;1(2):152–162. 🔗 https://pubmed.ncbi.nlm.nih.gov/24622321/
10. Thomas EL, Frost G, Taylor-Robinson SD, Bell JD. Excess body fat in obese and normal-weight subjects. Nutrition Research Reviews. 2012;25(1):150–161. 🔗 https://pubmed.ncbi.nlm.nih.gov/22625426/
11. Rinella ME, Lazarus JV, Ratziu V, et al. A multisociety Delphi consensus statement on new fatty liver disease nomenclature. Hepatology. 2023;78(6):1966–1986. 🔗 https://pubmed.ncbi.nlm.nih.gov/37363821/
12. Petersen MC, Shulman GI. Mechanisms of insulin action and insulin resistance. Physiological Reviews. 2018;98(4):2133–2223. 🔗 https://pubmed.ncbi.nlm.nih.gov/30067154/
13. Sutton EF, Beyl R, Early KS, Cefalu WT, Ravussin E, Peterson CM. Early time-restricted feeding improves insulin sensitivity, blood pressure, and oxidative stress even without weight loss in men with prediabetes. Cell Metabolism. 2018;27(6):1212–1221. 🔗 https://pubmed.ncbi.nlm.nih.gov/29754952/
14. Espinoza KS, Snider AJ. Therapeutic potential for ceramide synthase inhibitors in lean metabolic dysfunction–associated steatotic liver disease. Current Opinion in Endocrinology, Diabetes and Obesity. 2024;31(4):150–157. 🔗 https://pubmed.ncbi.nlm.nih.gov/38577539/