
The TG HDL ratio is one of the most clinically informative calculations on a standard blood panel — and one of the most consistently overlooked in conventional practice. It can be calculated in three seconds from two values that are present in every basic lipid screening. It tells you, with reasonable accuracy, whether the liver is insulin resistant. And it can be elevated for years before fasting glucose, HbA1c, or any other marker on the panel crosses a conventional alarm threshold.
In my clinical practice in Germany, almost every patient who arrives with established metabolic dysfunction has had a TG/HDL ratio above 2.0 in their lab results for years. Not occasionally above. Consistently above. In their old panels, in their pre-diabetes panels, in the panels their GP looked at and said “everything is fine.” The ratio was there. The signal was there. Nobody calculated it.
This article explains what the TG/HDL ratio actually measures, why it works as a proxy for hepatic insulin resistance, what the clinically meaningful thresholds are, and — critically — how to interpret it in the context of the other markers on a standard panel so that it stops being a number and starts being a metabolic story.
What you will learn: What the TG/HDL ratio represents biologically | Why a ratio above 2.0 is a specific signal for hepatic insulin resistance | The clinically meaningful thresholds — and why they are different from what you will find on a German lab report | How to integrate the ratio with ALT, GGT, uric acid, and waist circumference into a coherent metabolic picture | Why the standard clinical focus on LDL distracts from the markers that actually predict metabolic disease trajectory
Clinical Perspective: What I See in Practice
The lipid panels I receive from new patients tell a remarkably consistent story. Not in the dramatic values — those come later, in the patients who arrive with established disease. In the unremarkable-looking panels. The ones that were called normal.
A patient sends me a recent blood panel. Triglycerides 143 mg/dL. HDL not tested. LDL 135 mg/dL, flagged in red on the lab report. The cover note from their GP highlights the LDL — they may need a statin, the patient is told. The triglycerides are sitting at 143 in the white space below the conventional 150 threshold and have not been mentioned. The HDL has not been measured, so the TG/HDL ratio cannot be calculated. The most clinically informative number on the panel does not exist on the panel.
This is not an isolated case. It is the pattern. The German marker hierarchy treats LDL as the dominant cardiovascular signal and treats triglycerides as a secondary lipid value that becomes interesting only when it crosses 150. HDL is frequently omitted. The result is that the relationship between TG and HDL — which is where the metabolic story actually lives — is structurally invisible in standard care.
When I look at a panel for the first time, my reasoning sequence is not random and it is not based on the order the markers appear on the lab report. It runs through five questions, in this order:
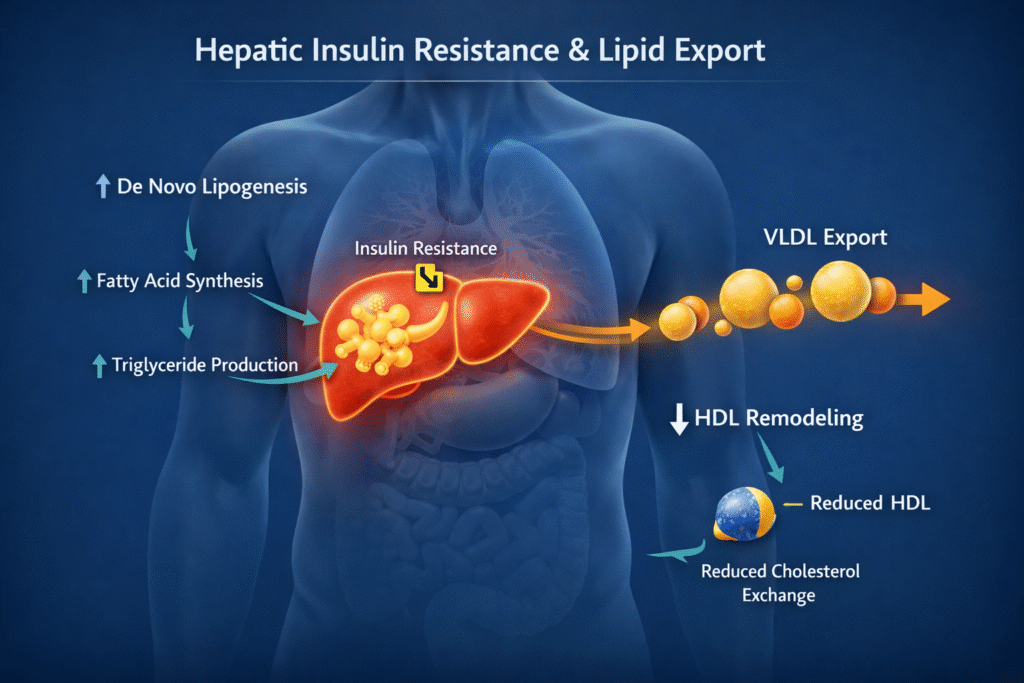
Step 1 — TG/HDL ratio. If the ratio is above 2.0 (mg/dL units), hepatic insulin resistance is operating. If it is above 3.0, hepatic insulin resistance is established. This is not a probabilistic suggestion — it is a mechanistic inference. An insulin-resistant liver overproduces triglyceride-rich VLDL particles, and the resulting lipid dynamics cause CETP-mediated HDL depletion. Elevated TG and suppressed HDL are not two independent findings. They are two readouts of the same liver-level process.
Step 2 — Liver enzymes locate the dysfunction. ALT disproportionately elevated relative to AST is the classic pattern of metabolic fatty liver, distinguishing it from alcohol-driven hepatic stress where AST typically exceeds ALT. GGT may appear normal at this stage — GGT rises later in metabolic stress, while ALT can be an earlier indicator. An ALT above the functional concern threshold of 35 U/L in the presence of an elevated TG/HDL ratio essentially confirms that the hepatic insulin resistance the ratio suggested is producing measurable hepatic fat accumulation.
Step 3 — Glucose tells you the stage. Fasting glucose still in the normal range with the TG/HDL pattern above tells me compensation is intact — the pancreas is still managing glucose despite the hepatic dysfunction. Fasting glucose above 100 mg/dL with the same lipid pattern tells me compensation has begun to fail. Fasting glucose above 125 mg/dL — and in one recent patient, 157 mg/dL — tells me the compensatory phase is over and we are now in established hyperglycemia, with the underlying dysfunction having developed silently for years before reaching this point.
Step 4 — Uric acid reveals the fructose layer. Uric acid is not a gout marker that occasionally drifts up. It is a metabolic marker. Elevated uric acid — above 7 mg/dL in men, above 6 in women — points to high fructose load, ATP depletion during fructose metabolism, and mitochondrial stress. It almost always parallels NAFLD because fructose is metabolized exclusively in the liver and is one of the most potent drivers of hepatic de novo lipogenesis. A uric acid of 7.9 mg/dL in the same panel as an elevated TG/HDL ratio and elevated ALT tells me ultra-processed food and refined sweetener consumption is significant in this patient’s diet, regardless of what they have reported about their eating habits.
Step 5 — Bilirubin adds context. Mildly elevated bilirubin — 1.5 to 2.0 mg/dL — can be benign (Gilbert syndrome is common) or it can reflect reduced hepatic clearance under metabolic stress. In isolation it tells me nothing. Combined with the pattern above, it is one more signal that the liver is operating at the edge of its capacity.
A recent patient panel illustrated this sequence perfectly. Fasting glucose 157 mg/dL — significantly elevated. Triglycerides 162 mg/dL — described in the GP’s notes as “slightly elevated,” which is a clinical understatement when the HDL is 45. The calculated TG/HDL ratio of approximately 3.6 was not mentioned in the GP’s interpretation. ALT 81 U/L — significantly elevated, the lab flagged it but the GP’s note attributed it to general “Leberstress” without connecting it to the lipid pattern. GGT 25 U/L — within the conventional reference range, but in context, sitting where it does within an already-stressed hepatic environment. Bilirubin 1.8 mg/dL — mildly elevated. Uric acid 7.9 mg/dL — significantly elevated. LDL 136 mg/dL — flagged and discussed at length in the consultation.
The patient walked out of the appointment with a recommendation to consider a statin. What the panel actually showed was a metabolic fatty liver in an active state of insulin resistance with a clear fructose driver, glucose dysregulation that had now broken through the compensatory ceiling, and a trajectory pointing directly toward type 2 diabetes within months to a year. None of that was named in the GP’s letter. The LDL was named. The LDL was where the conversation went.
This is the marker hierarchy error I see repeatedly. A triglyceride of 143 mg/dL goes unflagged because it sits below 150. An LDL of 139 mg/dL gets emphasized and clinically over-interpreted. The TG/HDL ratio is not calculated. The HDL, on some panels, is not even tested. The result is a clinical conversation about cholesterol transport while the metabolic dysfunction that will actually produce the cardiovascular event five or ten years from now is sitting on the panel, unread.
A separate patient, a man in his mid-40s, came to me with triglycerides at 180 mg/dL and HDL at 42 mg/dL — TG/HDL approximately 4.3. His glucose was 102 mg/dL. His ALT was mildly elevated. The GP had called the panel “acceptable.” Six months later, his ALT had doubled, his HbA1c had risen, and ultrasound confirmed hepatic steatosis. The TG/HDL ratio had predicted the trajectory before glucose or ultrasound had caught up. This is the rule, not the exception. Lipid flux changes precede overt glucose dysregulation. The TG/HDL ratio is frequently the earliest warning the standard panel will give you.
When I explain this to patients — that the ratio of two numbers on their existing panel could have flagged this dysfunction years earlier, that nobody calculated it, that the focus was on the wrong marker — the reaction is consistent. They are not angry. They are tired. They have been doing the work the system told them to do, eating less fat, taking the medication, getting the cholesterol panels checked, while the actual driver of their metabolic decline was sitting in plain view on every lab report they have ever had.
The TG/HDL ratio is not a fringe metric. It is the most clinically actionable single calculation available on standard German blood work for identifying hepatic insulin resistance before it has produced overt disease. The decision not to calculate it is the decision not to find what is there.
What the TG/HDL Ratio Actually Measures
The TG/HDL ratio is the result of dividing the triglyceride value by the HDL cholesterol value, using the same units (typically mg/dL in clinical practice). The calculation produces a single number that reflects the relationship between two interconnected lipid dynamics: triglyceride export from the liver, and HDL particle stability in circulation.
The mechanistic story behind the ratio runs through three steps. In the insulin-resistant liver, glucose and substrate load exceed the liver’s oxidative and glycogen storage capacity. The excess is converted to triglycerides through de novo lipogenesis and packaged into VLDL particles for export into systemic circulation. This is the source of the elevated triglyceride value on the panel.
These VLDL particles do not travel alone. In circulation, cholesteryl ester transfer protein (CETP) mediates an exchange between VLDL and HDL — triglycerides move from VLDL into HDL particles, and cholesteryl esters move in the opposite direction. The result is that HDL particles become enriched with triglycerides. These TG-rich HDL particles are then acted upon by hepatic lipase, which strips the triglycerides off and produces smaller, less stable HDL particles that are cleared from circulation more rapidly.
The end result is the lipid signature of hepatic insulin resistance: elevated triglycerides driving the numerator, depleted HDL pulling down the denominator, and a ratio that rises in proportion to the underlying dysfunction. Elevated TG and low HDL are not two independent abnormalities. They are two readouts of the same hepatic process — which is why the ratio captures the dysfunction better than either value in isolation.
This is also why the ratio is mechanistically tied to insulin resistance specifically and not to general cardiovascular risk in the way LDL is conventionally framed. The TG/HDL ratio measures something about the metabolic environment inside the liver. LDL measures something about the cholesterol transport system in the bloodstream. They are not measuring the same thing, and they do not predict the same outcomes.
Clinically Meaningful Thresholds
The TG/HDL ratio operates on a continuum, but for clinical interpretation, the following thresholds are useful (using mg/dL units):
Below 1.5 — typically reflects good hepatic insulin sensitivity. The lipid environment suggests the liver is processing energy substrate efficiently and HDL particles are stable in circulation.
1.5 to 2.0 — borderline. Often seen in individuals with early metabolic strain that has not yet produced overt dysfunction. Worth monitoring, particularly in the context of other markers and trends over time.
Above 2.0 — clinically meaningful signal for hepatic insulin resistance. In my practice this threshold raises immediate suspicion and prompts further investigation — fasting insulin if not yet measured, liver enzymes interpreted against functional thresholds, waist circumference, dietary history.
Above 3.0 — hepatic insulin resistance is established. The lipid dynamics described above are operating at a level that produces sustained metabolic consequences. Intervention is no longer about prevention. It is about reversal of an active process.
Above 4.0 — advanced metabolic dysfunction. Frequently associated with established NAFLD, significant visceral adiposity, and elevated cardiovascular risk through mechanisms that are mechanistically downstream of the underlying hepatic insulin resistance.
If the panel uses mmol/L units instead of mg/dL (more common in some European laboratories), the corresponding thresholds shift. Above 0.87 in mmol/L is approximately equivalent to above 2.0 in mg/dL. Above 1.3 in mmol/L is approximately equivalent to above 3.0 in mg/dL. Confirm which units your panel uses before calculating.
These thresholds are not codified in conventional cardiovascular guidelines because conventional guidelines are organized around LDL and total cholesterol targets, not insulin resistance markers. They reflect the functional thresholds used in metabolic medicine practice and align with the mechanistic understanding of what the ratio represents.
Integrating the Ratio With the Rest of the Panel
The TG/HDL ratio is most clinically informative when read alongside the other markers on a standard panel. The five-step sequence I described in the Clinical Perspective section above operates as the framework. Here is the same logic applied prospectively to interpreting an unknown panel:
Start with the ratio. If it is below 2.0, hepatic insulin resistance is unlikely to be the dominant driver of whatever brought the patient in. If it is above 2.0, hepatic insulin resistance is on the table and the rest of the panel needs to be read against that hypothesis.
Look at ALT and GGT. ALT above 35 U/L (functional threshold, well below the conventional upper limit of around 50 U/L) in the context of an elevated TG/HDL ratio supports hepatic fat accumulation as the mechanism. GGT above 30 U/L adds an oxidative stress and gut-liver axis signal — particularly relevant if there is a history of ultra-processed food consumption, repeated antibiotic use, or polypharmacy. AST elevation disproportionate to ALT shifts the picture toward alcohol involvement and should prompt different questions.
Check fasting glucose. Below 100 mg/dL with an elevated TG/HDL ratio means compensation is still intact. 100 to 125 mg/dL means compensation is beginning to fail. Above 125 mg/dL means the compensatory phase is over and the lipid pattern has been operating for years to produce this trajectory.
Look at uric acid. Above 7 mg/dL in men or 6 mg/dL in women with an elevated TG/HDL ratio is a fructose signal — refined sweeteners, sugar-sweetened beverages, HFCS-containing ultra-processed foods. Uric acid above 8 mg/dL frequently parallels established NAFLD.
Measure waist circumference. Above 94 cm in men or 80 cm in women indicates visceral adiposity, which feeds the portal vein with free fatty acids that compound the hepatic insulin resistance the ratio is signaling. Waist-to-height ratio above 0.5 is a sensitive functional threshold.
If multiple markers in this sequence are above functional thresholds simultaneously, the diagnostic picture coheres. The TG/HDL ratio is not telling you something the rest of the panel disagrees with — it is telling you the same story the rest of the panel is telling, in a calculation that is easier to interpret than any single marker alone.
Why the LDL Focus in Conventional Practice Misses the Story
The clinical attention given to LDL in standard German practice — and in most Western primary care — has a long history rooted in the cardiovascular risk literature of the 1980s and 1990s. That literature was not wrong. LDL is causally implicated in atherosclerosis. The problem is not that LDL matters. The problem is that the standard approach treats LDL as the dominant cardiovascular signal in a way that systematically obscures the metabolic drivers that produce the LDL elevation in the first place.
In a patient with hepatic insulin resistance, the lipid panel typically shows elevated triglycerides, suppressed HDL, elevated LDL, and within the LDL fraction, a shift toward small dense LDL particles that are more atherogenic than the larger buoyant LDL of metabolically healthy individuals. The LDL number on the panel is a downstream marker of the same hepatic dysfunction the TG/HDL ratio is signaling.
Treating the LDL elevation with a statin lowers the LDL value without addressing the upstream insulin resistance that is driving the entire lipid pattern. The triglyceride elevation persists. The HDL suppression persists. The hepatic fat accumulation persists. The cardiovascular risk reduction from statin therapy in this population is real but partial — and the metabolic trajectory continues toward type 2 diabetes, NAFLD, and the full sequence of insulin-resistance-driven disease.
The clinical conversation that would actually change the trajectory is the conversation about the TG/HDL ratio, the dietary drivers of hepatic fat accumulation, and the intervention that addresses the upstream cause. That conversation requires calculating the ratio, interpreting it against functional thresholds rather than conventional ones, and treating the lipid panel as a metabolic readout rather than a cholesterol-risk-stratification tool.
This is the conversation that almost never happens in standard care. Not because the GPs are careless. Because the framework is different, the time constraints are real, and the marker hierarchy in conventional cardiovascular guidelines treats LDL as the dominant signal.
What Improves the Ratio (And Why It Is Not Niacin)
The TG/HDL ratio improves when the upstream hepatic insulin resistance improves. It does not improve durably when HDL is raised pharmacologically without addressing the underlying mechanism. The large pharmaceutical trials of niacin and similar HDL-raising approaches have consistently failed to produce the cardiovascular risk reduction that the lipid value change would predict. Raising a number is not the same as restoring the system.
What does improve the ratio is the same set of interventions that improves hepatic insulin resistance — because the ratio reflects hepatic insulin resistance:
Reduction of dietary refined carbohydrate and fructose load. This is the most direct lever because it reduces the substrate flow that drives hepatic de novo lipogenesis and VLDL overproduction. Triglycerides fall first, often within weeks of significant dietary change.
Elimination of industrial seed oils, HFCS, and ultra-processed foods. These compounds drive the gut-liver axis inflammation that compounds hepatic insulin resistance independently of carbohydrate intake. Their elimination produces improvement that pure carbohydrate restriction does not.
Animal-based, protein-forward eating pattern with adequate dietary fat from whole-food sources. Provides satiety, supports lean mass, minimizes the insulinogenic load relative to carbohydrate-based patterns, and removes the dietary contributors to the hepatic fat environment.
Time-restricted eating with extended overnight fasting. Reduces total insulin exposure across the day and allows hepatic lipid metabolism to operate in a fasted state for longer periods, improving fat oxidation capacity.
Resistance training and structured movement. Builds skeletal muscle insulin sensitivity, reduces visceral adiposity over time, and reduces the compensatory insulin load that maintains the hepatic dysfunction.
These interventions work because they address the upstream cause. The TG/HDL ratio is one of the most responsive markers in metabolic intervention — patients who implement these changes consistently typically see meaningful reductions in the ratio within 8 to 16 weeks. The marker moves because the underlying physiology moves.
A Note on Uncertainty
The TG/HDL ratio is a clinically useful proxy for hepatic insulin resistance, but it is a proxy, not a direct measurement. The mechanistic relationship between elevated triglycerides, depleted HDL, and hepatic insulin signaling is well-established in the research literature. The specific thresholds — above 2.0 as a signal, above 3.0 as established dysfunction — are derived from clinical observation and supporting epidemiological data rather than from a single definitive randomized controlled trial.
Individual variability is real. Genetic factors influence HDL levels independently of metabolic state. Lipid values can fluctuate based on recent eating, alcohol intake, illness, and timing of the draw. A single ratio above 2.0 in an otherwise healthy individual is a signal to investigate further — not a diagnosis. The clinical picture, the trajectory across multiple panels over time, and the context of other markers always matters more than a single calculation in isolation.
The framework presented here is one I have found clinically reliable across hundreds of patients in functional medicine practice. It is not the only framework in use. Conventional cardiovascular medicine continues to prioritize LDL-based risk assessment, and the choice of which framework to apply depends on what question is being asked. For the question of whether hepatic insulin resistance is operating before glucose has become abnormal, the TG/HDL ratio is among the most useful tools available without specialized testing.
Practical Implications
If your last lab panel includes both triglycerides and HDL, you can calculate your TG/HDL ratio in three seconds. Divide one by the other. If the result is above 2.0 in mg/dL units (or above 0.87 in mmol/L), the panel is signaling hepatic insulin resistance regardless of whether anyone in the clinical chain interpreted it that way.
If your panel does not include HDL, request it at your next blood draw alongside triglycerides. HDL is inexpensive, routine, and present on virtually every basic lipid panel that includes it. The decision to omit it limits the diagnostic information available from the panel substantially.
If your TG/HDL ratio is above 2.0, the appropriate next questions are: what does the rest of the panel show, what is the trajectory over previous panels, and what intervention addresses the upstream cause. The answer to that last question is not a statin in most cases — it is the dietary, fasting, and movement-based approach that addresses the hepatic insulin resistance directly.
For the full framework on interpreting fasting insulin within an optimal range, see the dedicated article fasting insulin within an optimal range.
If your TG/HDL ratio is above 3.0, established hepatic insulin resistance is operating and the intervention timeline is not theoretical. The trajectory from this point, in the absence of meaningful change, runs through NAFLD, prediabetes, type 2 diabetes, and cardiovascular events. The ratio is telling you the trajectory is active. The intervention is correspondingly urgent.
The TG/HDL ratio is not a fringe metric. It is the most clinically actionable single calculation available on standard blood work for identifying hepatic insulin resistance before it has produced overt disease. The decision not to calculate it is the decision not to find what is there.
People Also Ask
What is a healthy TG/HDL ratio?
In mg/dL units, a TG/HDL ratio below 1.5 typically reflects good hepatic insulin sensitivity. Below 2.0 is acceptable in most clinical contexts. Above 2.0 raises suspicion for hepatic insulin resistance. Above 3.0 indicates established hepatic insulin resistance and warrants intervention regardless of whether glucose or HbA1c have yet become abnormal.
What does a high TG/HDL ratio mean?
A TG/HDL ratio above 2.0 reflects the lipid signature of hepatic insulin resistance — elevated triglyceride export from the liver via VLDL overproduction, combined with HDL depletion through CETP-mediated triglyceride exchange and accelerated HDL clearance. The two values are not independent findings; they are two readouts of the same underlying hepatic process. A ratio above 2.0 is a specific signal that the liver is operating in an insulin-resistant state.
Is the TG/HDL ratio more important than LDL?
For the specific question of identifying hepatic insulin resistance and predicting metabolic disease trajectory, the TG/HDL ratio is substantially more informative than LDL. LDL reflects cholesterol transport dynamics; TG/HDL reflects hepatic metabolic state. They measure different things. In conventional cardiovascular guidelines, LDL receives more clinical attention, but in the context of identifying early metabolic dysfunction before glucose has become abnormal, the TG/HDL ratio is the more useful marker.
Can the TG/HDL ratio detect insulin resistance before glucose rises?
Yes — and this is one of its central clinical values. The lipid dynamics that produce an elevated TG/HDL ratio operate at the hepatic level and frequently produce a measurable signal in the panel years before fasting glucose, HbA1c, or postprandial glucose tolerance demonstrate abnormality. The compensatory phase of insulin resistance — during which the pancreas is producing increased insulin to maintain normal glucose — typically produces an elevated TG/HDL ratio long before that compensation fails.
How do I lower my TG/HDL ratio?
The TG/HDL ratio improves when the underlying hepatic insulin resistance improves. The most effective interventions are reduction of dietary refined carbohydrate and fructose load, elimination of industrial seed oils and ultra-processed foods, an animal-based protein-forward eating pattern, time-restricted eating with extended overnight fasting, and resistance training combined with structured movement. Pharmacological HDL-raising approaches do not produce equivalent metabolic benefit and have not demonstrated cardiovascular risk reduction in large trials.
Why don’t doctors calculate the TG/HDL ratio?
In standard German and most Western primary care practice, the clinical framework prioritizes LDL-based cardiovascular risk assessment. The TG/HDL ratio is not codified in conventional cardiovascular guidelines, the relationship between hepatic insulin resistance and lipid dynamics is not emphasized in standard medical training, and the time constraints of a typical primary care consultation do not accommodate the additional interpretation step. The result is that the calculation is rarely performed despite both values being present on most standard panels.
About the Author
Morteza Ariana is a State-Certified Functional Nutritionist based in Germany, specializing in insulin resistance, type 2 diabetes, and root-cause metabolic restoration. He holds advanced training in systems-based physiology and has worked with patients across the U.S. and Europe for over 10 years.
His clinical framework is built around a core principle that mainstream medicine consistently overlooks: chronically elevated insulin — not blood glucose — is the earliest and most actionable driver of metabolic disease. That conviction was shaped in part by his own experience with hyperinsulinemia in 2016, and deepened through a decade of clinical practice and the study of leading researchers in metabolic medicine including Benjamin Bikman, Joseph Kraft, Gerald Reaven, Jason Fung, and Stephen Phinney.
His work focuses on identifying and correcting the upstream metabolic signals — insulin load, liver-gut axis dysfunction, circadian misalignment, and micronutrient gaps — that standard screening misses entirely. Patient outcomes are documented, anonymized, and published on this site.
If this resonates, the next step is clarity
The Metabolic Restoration Blueprint is a structured 12-week framework designed to correct upstream metabolic drivers — not just manage symptoms.
Scientific References
McLaughlin T, Reaven G, Abbasi F, et al. Is there a simple way to identify insulin-resistant individuals at increased risk of cardiovascular disease? American Journal of Cardiology. 2005;96(3):399–404. 🔗 https://pubmed.ncbi.nlm.nih.gov/16054467/
Salazar MR, Carbajal HA, Espeche WG, et al. Relation among the plasma triglyceride/high-density lipoprotein cholesterol concentration ratio, insulin resistance, and associated cardio-metabolic risk factors in men and women. American Journal of Cardiology. 2012;109(12):1749–1753. 🔗 https://pubmed.ncbi.nlm.nih.gov/22449634/
Hannon BA, Edwards CG, Thompson SV, et al. Triglyceride/HDL cholesterol ratio and metabolic syndrome as contributors to cardiovascular risk in overweight and obese adults. Nutrients. 2019;11(11):2585. 🔗 https://pmc.ncbi.nlm.nih.gov/articles/PMC6893611/
Adams-Huet B, Devaraj S, Siegel D, Jialal I. Increased adipose tissue insulin resistance in metabolic syndrome: relationship to circulating adipokines. Metabolic Syndrome and Related Disorders. 2014;12(10):503–507. 🔗 https://pubmed.ncbi.nlm.nih.gov/25211295/
Reaven GM. Role of insulin resistance in human disease. Diabetes. 1988;37(12):1595–1607. 🔗 https://pubmed.ncbi.nlm.nih.gov/3056758/
Petersen MC, Shulman GI. Mechanisms of insulin action and insulin resistance. Physiological Reviews. 2018;98(4):2133–2223. 🔗 https://pubmed.ncbi.nlm.nih.gov/30067154/
Bhatt DL, Steg PG, Miller M, et al. Cardiovascular risk reduction with icosapent ethyl for hypertriglyceridemia. New England Journal of Medicine. 2019;380(1):11–22. 🔗 https://pubmed.ncbi.nlm.nih.gov/30415628/
Boden G. Obesity, insulin resistance and free fatty acids. Current Opinion in Endocrinology, Diabetes and Obesity. 2011;18(2):139–143. 🔗 https://pubmed.ncbi.nlm.nih.gov/21297467/
Lambert JE, Ramos-Roman MA, Browning JD, Parks EJ. Increased de novo lipogenesis is a distinct characteristic of individuals with nonalcoholic fatty liver disease. Gastroenterology. 2014;146(3):726–735. 🔗 https://pubmed.ncbi.nlm.nih.gov/24316260/
Stanhope KL, Schwarz JM, Keim NL, et al. Consuming fructose-sweetened, not glucose-sweetened, beverages increases visceral adiposity and lipids and decreases insulin sensitivity in overweight/obese humans. Journal of Clinical Investigation. 2009;119(5):1322–1334. 🔗 https://pubmed.ncbi.nlm.nih.gov/19381015/
Sanyal AJ, Campbell-Sargent C, Mirshahi F, et al. Nonalcoholic steatohepatitis: association of insulin resistance and mitochondrial abnormalities. Gastroenterology. 2001;120(5):1183–1192. 🔗 https://pubmed.ncbi.nlm.nih.gov/11266382/
Lonardo A, Nascimbeni F, Mantovani A, Targher G. Hypertension, diabetes, atherosclerosis and NASH: cause or consequence? Journal of Hepatology. 2018;68(2):335–352. 🔗 https://pubmed.ncbi.nlm.nih.gov/29122390/
Volek JS, Phinney SD, Forsythe CE, et al. Carbohydrate restriction has a more favorable impact on the metabolic syndrome than a low fat diet. Lipids. 2009;44(4):297–309. 🔗 https://pubmed.ncbi.nlm.nih.gov/19082851/
Hyde PN, Sapper TN, Crabtree CD, et al. Dietary carbohydrate restriction improves metabolic syndrome independent of weight loss. JCI Insight. 2019;4(12):e128308. 🔗 https://pubmed.ncbi.nlm.nih.gov/31217353/