The HOMA-IR insulin resistance test is one of the most revealing calculations in metabolic medicine — and one of the least ordered by general practitioners. If your doctor has never mentioned it, you are not alone. Most standard blood panels measure fasting glucose but ignore fasting insulin entirely, which means early insulin resistance can go undetected for years while damage quietly accumulates.
HOMA-IR is often presented as a simple answer to a complex question:
“Am I insulin resistant?”
It is neither a magic number nor a useless calculation.
Used properly, it is a powerful early signal.
Used blindly, it becomes another false reassurance.
Let’s be precise.
What HOMA-IR Actually Measures
HOMA-IR stands for Homeostatic Model Assessment of Insulin Resistance.
It is calculated using:
- Fasting glucose
- Fasting insulin
The idea is simple:
If glucose is normal but insulin is elevated,
the body is compensating.
HOMA-IR attempts to quantify that compensation mathematically.
In other words:
HbA1c tells you the outcome.
Fasting insulin tells you the effort.
HOMA-IR expresses the relationship between the two.
That relationship is what matters.
This is why relying on HbA1c alone can miss early dysfunction — a dynamic explored in detail when comparing fasting insulin vs HbA1c directly.
How HOMA-IR Is Calculated
HOMA-IR is calculated using fasting insulin and fasting glucose measured at the same time point.
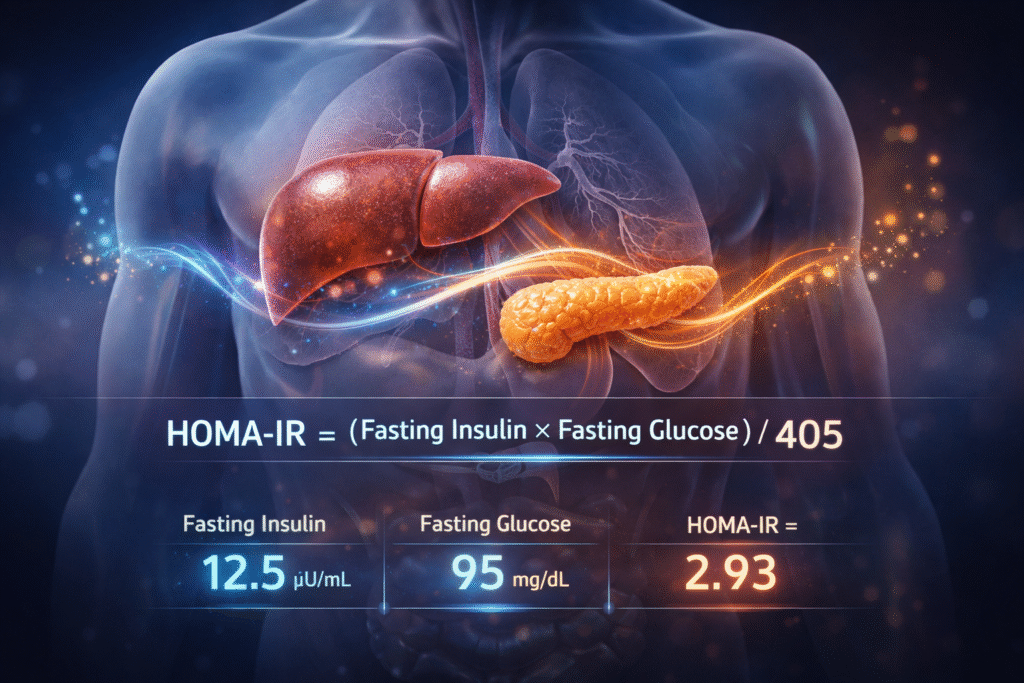
The standard formula (when glucose is measured in mg/dL) is:
HOMA-IR = (Fasting Insulin × Fasting Glucose) / 405
If glucose is measured in mmol/L, the formula changes slightly:
HOMA-IR = (Fasting Insulin × Fasting Glucose) / 22.5
The purpose of the calculation is simple:
- If glucose is normal but insulin is elevated, the result increases.
- If both insulin and glucose are low and stable, the result remains low.
- If glucose begins to rise despite insulin being elevated, compensation may be failing.
The number itself is not the point.
The relationship between insulin and glucose is.
That relationship reflects how hard the body must work at baseline to maintain glucose stability — and that effort is what HOMA-IR attempts to estimate.
| Fasting Insulin (µU/mL) | Fasting Glucose (mg/dL) | HOMA-IR |
| 6 | 85 | 1.26 |
| 12.5 | 95 | 2.93 |
| 18 | 100 | 4.44 |
Why HOMA-IR Exists in the First Place
Insulin resistance does not begin with high glucose.
It begins with:
- Reduced tissue sensitivity
- Increased insulin secretion
- Preserved glucose — for a while
Researchers needed a way to estimate insulin resistance in large populations without performing complex clamp studies.
HOMA-IR was developed as a practical surrogate.
It correlates reasonably well with more advanced measurements of insulin resistance in research settings.
That is not controversial.
What a “Normal” HOMA-IR Does — and Does Not — Mean
This is where interpretation matters.
A low HOMA-IR generally suggests:
- low fasting insulin
- stable fasting glucose
- minimal compensation at baseline
But it does not guarantee:
- good post-meal insulin dynamics
- metabolic flexibility
- absence of early liver stress
- absence of visceral fat accumulation
It measures one moment — fasting.
Metabolism is not only fasting.
This is part of the broader problem of being told everything looks normal while subtle metabolic strain is already building.
The Problem With Single-Number Thinking
Medicine likes thresholds.
But insulin resistance is not a switch.
It is a continuum.
HOMA-IR rises gradually as:
- Sleep quality declines
- Visceral fat accumulates
- Liver fat increases
- Physical activity decreases
- Chronic stress persists
There is no sharp line between “healthy” and “unhealthy.”
And pretending there is creates diagnostic complacency.
What Is a Good HOMA-IR Range?
This is where nuance matters.
There is no single universal cutoff that separates “healthy” from “unhealthy.” HOMA-IR exists on a continuum, and interpretation depends on age, body composition, liver health, and metabolic context.
That said, broad population data suggest:
- Values around 1.0 or lower are commonly seen in individuals with high insulin sensitivity.
- Values between 1.0 and 2.0 may still be metabolically stable, depending on context.
- Values above 2.0–2.5 often indicate increasing insulin resistance in many populations.
- Higher values suggest greater compensatory insulin effort.
But the number alone is not decisive.
A HOMA-IR of 2.3 in a sedentary individual with rising ALT and a worsening TG:HDL ratio means something different than the same number in a young, active person with stable markers.
The real question is not:
“Is my number above a cutoff?”
It is:
“Is my metabolism compensating more than it should — and is that trend improving or worsening?”
Ranges provide orientation.
Trends provide meaning.
When HOMA-IR Is Most Useful
HOMA-IR is particularly valuable when:
- HbA1c is normal
- Fasting glucose is normal
- Symptoms suggest metabolic strain
- ALT or GGT are drifting upward
- TG:HDL ratio is worsening
In this context, an elevated HOMA-IR confirms what physiology is already signaling.
It validates early dysfunction before glucose rises.
This is precisely the window where intervention is easiest.
When HOMA-IR Is Less Informative
HOMA-IR can be misleading when:
- Insulin secretion is already declining
- Advanced beta-cell dysfunction is present
- The person is on glucose-lowering medication
- Only one measurement is used without trend analysis
A person with advanced metabolic disease can have:
- Normal or low fasting insulin
- Normal HOMA-IR
Because the pancreas is no longer compensating.
That is not health.
That is exhaustion.
This is why interpretation requires context.
HOMA-IR and Liver Health
There is a direct link between:
- Elevated HOMA-IR
- Hepatic insulin resistance
- Fat accumulation in the liver
The liver is often the first organ to become insulin resistant.
When that happens:
- Glucose output increases
- Triglyceride production rises
- ALT and GGT may begin drifting upward
HOMA-IR often rises alongside these changes.
It is not a liver test.
But it often reflects hepatic strain indirectly.
Why Most People Are Not Tested Early Enough
In conventional care, HOMA-IR is rarely emphasized because:
- It is not required for diabetes diagnosis
- Guidelines prioritize glucose thresholds
- Insurance coding focuses on disease, not dysfunction
But if your goal is to detect metabolic instability early,
HOMA-IR is one of the simplest tools available.
Ignoring it delays clarity.
In research settings, HOMA-IR correlates reasonably well with clamp-based measures of insulin sensitivity — but clinical interpretation still requires context.
What HOMA-IR Cannot Tell You
Let’s be honest about limits.
HOMA-IR does not measure:
- Post-prandial insulin spikes
- Circadian misalignment
- Muscle insulin sensitivity directly
- Mitochondrial function
- Inflammatory signaling
It is a fasting snapshot, not a full metabolic map.
And it should never be interpreted alone.
The Correct Way to Use HOMA-IR
HOMA-IR becomes powerful when interpreted alongside:
- Fasting insulin
- TG:HDL ratio
- ALT and GGT
- Waist circumference or visceral fat indicators
- Sleep patterns
- Symptom patterns
In isolation, it is a number.
In context, it becomes a story.
HOMA-IR becomes more meaningful when interpreted alongside lipid patterns that reflect insulin resistance.
The Bigger Point
If someone tells you:
“Your HOMA-IR is normal, so you’re fine.”
That statement is incomplete.
If someone tells you:
“Your HOMA-IR is elevated, so you’re doomed.”
That statement is equally incomplete.
HOMA-IR is not a verdict.
It is a signal.
The question is not:
“Is my number above a threshold?”
The question is:
“Is my metabolism compensating — and for how long?”
That is where real interpretation begins.
Ultimately, HOMA-IR is not about numbers alone but about understanding insulin resistance as the central metabolic failure driving downstream dysfunction.
What to Do With This Information
If you’ve never had fasting insulin measured,
you do not know your HOMA-IR.
If your glucose looks normal but your symptoms do not,
HOMA-IR may provide missing context.
But context requires interpretation.
Not reaction.
If you want a structured evaluation of insulin, liver markers, lipids, and symptom patterns — rather than isolated numbers — you have the option to work with me through a Clinical Metabolic Assessment — interpretation before intervention.
Because early metabolic dysfunction is reversible.
Late metabolic disease is harder.
The difference is timing.
People Also Ask
What is a normal HOMA-IR value?
HOMA-IR varies by population, but lower values generally indicate better insulin sensitivity. Interpretation depends on context, not a single cutoff.
Can HOMA-IR detect early insulin resistance?
Yes. Elevated HOMA-IR often appears before fasting glucose or HbA1c rise, reflecting compensatory hyperinsulinemia.
Is HOMA-IR accurate?
It correlates reasonably well with clamp-based measurements in research but should not be used in isolation.
Should HOMA-IR be tested routinely?
It can provide valuable early insight when interpreted alongside liver markers, lipid patterns, and clinical context.
Author bio
Morteza Ariana is a Functional Nutrition Practitioner specializing in insulin resistance, type 2 diabetes, and systems-based metabolic restoration. His work focuses on identifying upstream drivers of metabolic dysfunction — including insulin load, liver–gut axis disruption, circadian misalignment, and micronutrient gaps — rather than masking symptoms.
He works with high-performing professionals through a structured 12-week Metabolic Restoration Blueprint designed to restore metabolic flexibility and long-term resilience.
If this resonates, the next step is clarity.
The Metabolic Restoration Blueprint is a structured 12-week framework designed to correct upstream metabolic drivers — not just manage symptoms.
Scientific References
Matthews DR et al. (1985)
Homeostasis model assessment: insulin resistance and beta-cell function from fasting plasma glucose and insulin concentrations. Diabetologia. PubMed
Wallace TM, Levy JC, Matthews DR (2004)
Use and abuse of HOMA modeling. Diabetes Care. PubMed
Tabák AG et al. (2009)
Trajectories of glycemia, insulin sensitivity, and insulin secretion before diagnosis of type 2 diabetes. The Lancet.
Shanik MH et al. (2008)
Insulin resistance and hyperinsulinemia: is hyperinsulinemia the cart or the horse?
Diabetes Care. PubMed
Marchesini G et al. (2001)
Nonalcoholic fatty liver disease: a feature of the metabolic syndrome.
Diabetes. PubMed
Bonora E et al. (2000)
Homeostasis model assessment closely mirrors the glucose clamp technique in the assessment of insulin sensitivity: studies in subjects with various degrees of glucose tolerance and insulin sensitivity. PubMed