
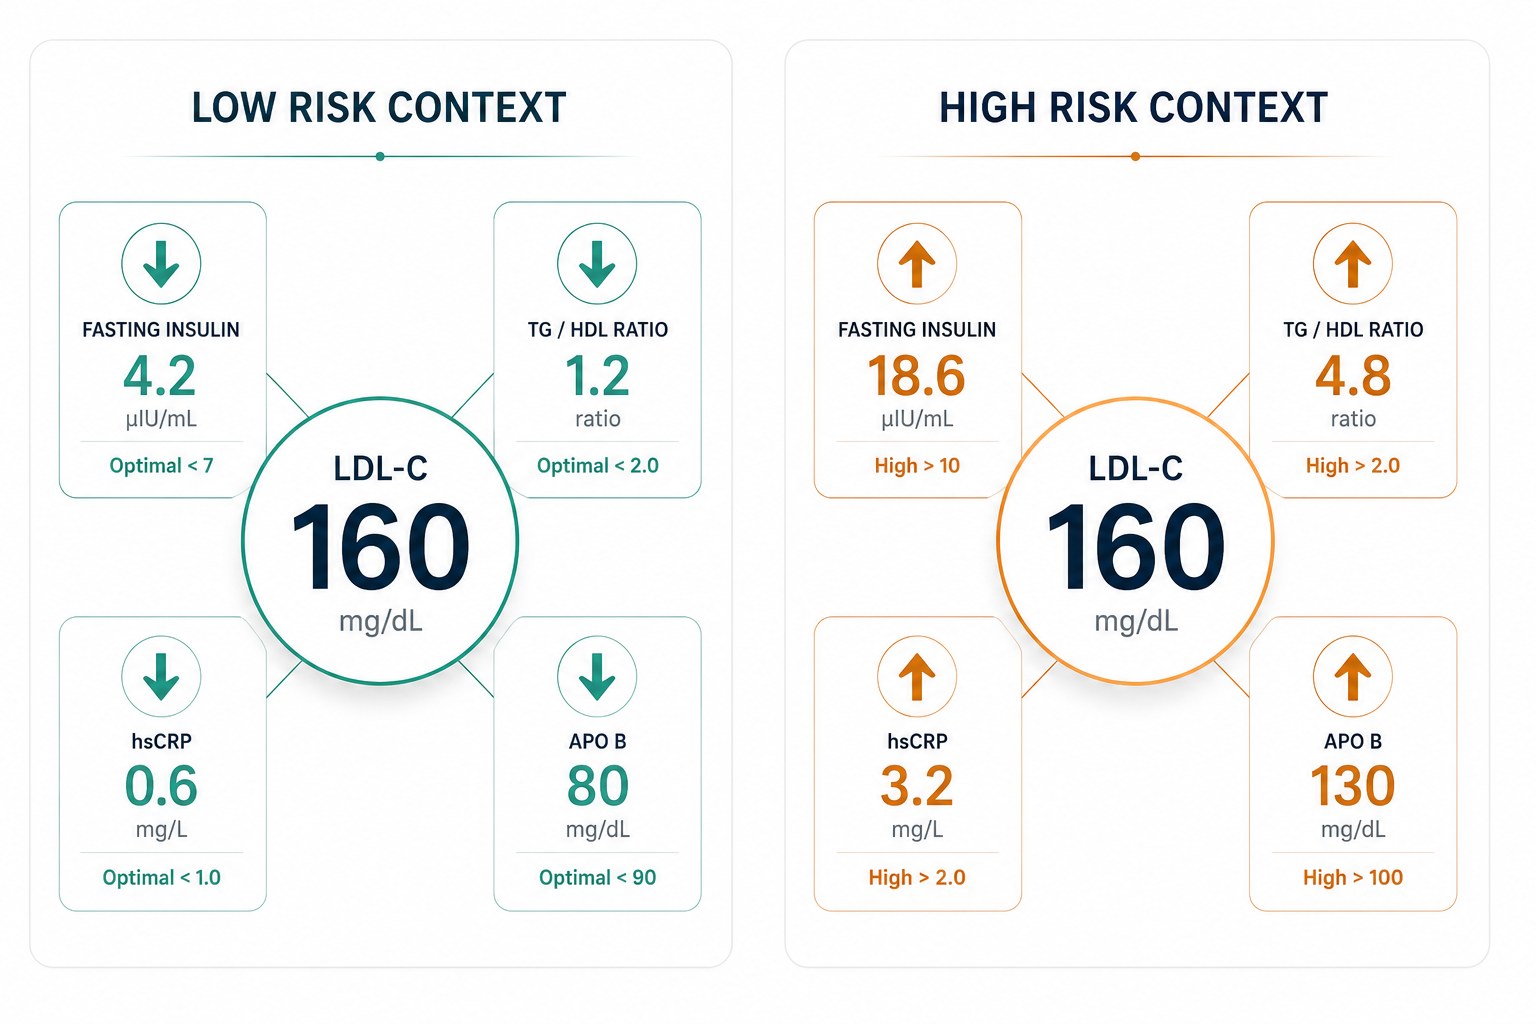
Cholesterol and cardiovascular risk cannot be read from a single number — the same LDL reading carries a fundamentally different risk profile depending on fasting insulin, ApoB, TG/HDL ratio, and hsCRP.
Cholesterol is not the enemy of cardiovascular health. It is one of the most essential molecules in the human body — the structural component of every cell membrane, the precursor to all steroid hormones, the raw material for vitamin D synthesis, and the dominant structural fat of the brain. The liver produces it continuously and supplies it to every tissue around the clock because every tissue requires it. A brain depleted of cholesterol does not function optimally. These are not controversial claims. They are established biochemistry.
What is controversial — and what the past seven decades of nutrition science have failed to resolve cleanly — is the precise relationship between circulating cholesterol, lipoprotein particles, and cardiovascular disease. The dominant clinical model, built on the diet-heart hypothesis and the LDL-lowering paradigm, has produced a framework in which a single number on a standard lipid panel determines whether a patient receives a statin prescription. That framework is clinically inadequate — not because LDL is irrelevant, but because LDL interpreted in isolation from the metabolic environment in which those particles circulate is incomplete information dressed up as a complete answer.
The central argument of this page is precise: cardiovascular risk cannot be assessed from a lipid panel read in isolation. The clinical meaning of an elevated LDL — the urgency it warrants, the risk it represents, the response it demands — is determined by the metabolic and vascular context in which those lipoprotein particles are operating. Insulin resistance, chronic inflammation, endothelial dysfunction, lipoprotein particle quality, and oxidative stress determine whether elevated LDL is a genuine threat or a number without proportionate clinical significance. The lipid panel captures one variable in a multi-variable system. Treating it as the system is where the standard model fails.
The Minnesota Coronary Experiment: What the Evidence Actually Showed
Before examining the mechanism, the evidence base deserves scrutiny — because one of the most important clinical trials in the diet-heart hypothesis was deliberately withheld from publication for sixteen years.
The Minnesota Coronary Experiment was conducted between 1968 and 1973 — a double-blind randomized controlled trial involving over 9,000 institutionalized patients in Minnesota psychiatric hospitals and nursing homes. It was the largest and most rigorously controlled dietary intervention trial of the diet-heart hypothesis ever conducted. Participants were randomized to either a diet replacing saturated fat with linoleic acid-rich corn oil and corn oil margarine, or a control diet higher in saturated fat. The intervention diet successfully lowered serum cholesterol — exactly as predicted by the diet-heart hypothesis.
The problem was what happened next. The group whose cholesterol fell the most did not have fewer heart attacks or lower mortality. They had more. For every 30 mg/dL reduction in serum cholesterol, the risk of death increased by 22 percent. The intervention designed to reduce cardiovascular risk by lowering cholesterol produced the opposite outcome in the trial’s own data.
The lead investigator Ivan Frantz did not publish the results. The data sat unpublished until 2016, when Christopher Ramsden and colleagues at the NIH recovered the original trial data and published the findings in the BMJ. When asked why the results were never published, Frantz’s co-investigator acknowledged that the findings were unexpected and went against the prevailing hypothesis.
The Minnesota Coronary Experiment is not a peripheral footnote. It is a foundational case study in what happens when clinical practice is built on a hypothesis before the evidence has been fully examined — and what happens when the evidence that challenges that hypothesis is not made available to the practitioners and patients who depend on it. It established what the subsequent decades of research have continued to demonstrate: lowering cholesterol is not the same as reducing cardiovascular risk, and the relationship between dietary fat, serum cholesterol, and heart disease is substantially more complex than the diet-heart hypothesis assumed.
For a detailed examination of the LDL-cardiovascular disease relationship and the evidence for and against the cholesterol hypothesis, see the post on [LDL physiology →]
What Cholesterol and Lipoproteins Actually Are
Cholesterol does not travel freely in the bloodstream. It is hydrophobic — it cannot dissolve in water-based plasma. To be transported through circulation, cholesterol and triglycerides are packaged into lipoprotein particles: complex structures with a lipid core surrounded by a phospholipid shell and surface proteins called apolipoproteins that determine where the particle goes and how it is metabolized.
The major lipoprotein classes — VLDL, IDL, LDL, and HDL — are not different types of cholesterol. They are different transport vehicles carrying cholesterol and triglycerides to different destinations for different purposes. LDL carries cholesterol from the liver to peripheral tissues that need it. HDL participates in reverse cholesterol transport, returning cholesterol from peripheral tissues to the liver for recycling or excretion. VLDL carries triglycerides synthesized in the liver out to peripheral tissues for energy use or storage.
The apolipoprotein on LDL particles is ApoB-100. Every LDL particle carries exactly one ApoB molecule. This means that ApoB concentration directly reflects the number of atherogenic lipoprotein particles in circulation — a measurement that LDL cholesterol concentration alone does not provide, because particle number and cholesterol content per particle can vary substantially between individuals and metabolic states.
This particle number distinction is clinically consequential. Two patients with identical LDL-C can have dramatically different ApoB concentrations — one with fewer large cholesterol-rich LDL particles, one with many small dense LDL particles carrying less cholesterol each but present in far greater numbers. The second phenotype — characteristic of insulin resistance and metabolic dysfunction — carries substantially higher cardiovascular risk at the same LDL-C reading. The standard lipid panel cannot distinguish between them.
For a detailed examination of lipoprotein particle transport and its clinical implications, see the post on [lipoprotein particle transport →]

The Metabolic Context That Determines Risk
In clinical practice, an elevated LDL is the beginning of a cardiovascular assessment — not its conclusion. The clinical meaning of that number, the risk it represents, and the urgency it warrants are all determined by the metabolic environment surrounding it.
The patient who warrants genuine concern is one in whom elevated LDL sits inside a broader metabolic phenotype: ApoB elevated and disproportionately high relative to LDL-C — indicating a pattern of small dense particles rather than large buoyant ones. Triglycerides and VLDL elevated, reflecting hepatic overproduction driven by hyperinsulinemia and carbohydrate load. Evidence of insulin resistance — elevated fasting insulin, impaired fasting glucose, or established type 2 diabetes.
Central adiposity and visceral fat accumulation. Fatty liver. Elevated blood pressure. Elevated Lp(a), which warrants measurement at least once in every cardiovascular risk assessment. Persistent elevation of hsCRP in an appropriate clinical context. Elevated homocysteine. Low vitamin B12 and vitamin D. Elevated liver enzymes. Smoking. Chronic kidney disease. Strong family history of premature atherosclerotic cardiovascular disease.
That constellation tells a coherent physiological story. Insulin resistance is driving VLDL overproduction, generating a lipid-rich environment in which triglyceride-depleted, cholesterol-enriched small dense LDL particles accumulate. Chronic inflammation — reflected in elevated hsCRP and driven by gut-derived LPS, visceral adipose tissue, and endothelial stress — is creating the oxidative environment in which LDL particles undergo modification and become atherogenic. The endothelium is under pressure from hyperinsulinemia-driven sympathetic activation and from the inflammatory cytokines that impair its barrier function. In this context, elevated LDL represents a genuinely elevated risk — not because the LDL number itself is the cause, but because it is one signal in a system that is failing across multiple dimensions simultaneously.
The patient who warrants a different clinical response is one in whom elevated LDL exists without that metabolic context: fasting insulin optimal, TG/HDL ratio below 2.0, hsCRP below 0.5, no central adiposity, no hypertension, no glucose dysregulation, no evidence of endothelial dysfunction or systemic inflammation. In this patient, elevated LDL in a metabolically healthy environment — particularly large buoyant LDL particles reflected in a low ApoB relative to LDL-C — carries a fundamentally different risk profile. The absolute risk is lower, the urgency is different, and the clinical response should reflect that difference rather than treating the number in isolation.
This is not a dismissal of LDL as a risk factor. Cumulative exposure to ApoB-containing particles matters — the atherogenic process is real and particle burden over time is a genuine contributor to cardiovascular risk. What changes dramatically between these two patients is their absolute risk, the trajectory of that risk, and what intervention most effectively addresses it. Lowering LDL with a statin in the second patient while leaving the metabolic dysfunction of the first patient unaddressed is a clinical misallocation of effort that the Minnesota Coronary Experiment’s findings made visible decades before the clinical establishment was ready to examine them.
For the clinical framework for ApoB interpretation and its relationship to LDL-C, see the post on [ApoB interpretation →]
Triglycerides, VLDL, and the Insulin Connection
The triglyceride number on a standard lipid panel is one of the most clinically informative and most consistently underinterpreted values in metabolic medicine. Elevated triglycerides are not primarily a dietary fat problem. They are a hepatic insulin resistance problem.
When insulin resistance develops in the liver, the suppression of hepatic glucose production that insulin normally mediates fails — the liver continues producing glucose and simultaneously accelerates de novo lipogenesis, converting excess carbohydrate substrate into triglycerides that are packaged into VLDL and released into circulation. The result is the elevated triglycerides, elevated VLDL, and low HDL that characterize the atherogenic dyslipidemia of insulin resistance — a lipid pattern that is far more predictive of cardiovascular risk than isolated LDL elevation and that responds directly to the interventions that reduce insulin load rather than those that lower cholesterol.
The TG/HDL ratio — triglycerides divided by HDL in mg/dL units — is the most accessible practical proxy for insulin resistance available on a standard lipid panel. A ratio above 2.0 reliably identifies the insulin-resistant lipid phenotype in the absence of a fasting insulin measurement. It is the number that most GPs never calculate and most patients never hear about.
For the detailed mechanism of triglyceride metabolism and its relationship to hepatic insulin resistance, see the post on [triglyceride metabolism →] and the post on [VLDL metabolism →]
HDL: Function Over Number
HDL cholesterol is routinely reported as “good cholesterol” — the higher the better. That framing is not wrong, but it is incomplete in a way that matters clinically.
HDL’s primary function is not passive cholesterol storage. It is an active participant in reverse cholesterol transport — the process by which cholesterol is retrieved from peripheral tissues and arterial walls and returned to the liver for recycling or excretion. HDL also carries anti-inflammatory proteins, antioxidants, and paraoxonase enzymes that protect LDL particles from oxidative modification. A high HDL number reflects not just quantity but the functional capacity of those particles to perform reverse transport and anti-inflammatory work.
In insulin resistance, HDL function is impaired independently of HDL concentration. Chronically elevated insulin accelerates HDL catabolism, reduces ApoA-I synthesis, and generates dysfunctional HDL particles that have lost their anti-inflammatory and reverse transport capacity while still registering as a number on a panel. A patient with HDL of 55 mg/dL in an insulin-resistant metabolic context has functionally different HDL than a patient with HDL of 55 mg/dL in a metabolically healthy one.
HDL concentration rises reliably as insulin sensitivity is restored — making it one of the most useful practical markers of metabolic recovery, particularly when tracked alongside the TG/HDL ratio over time.
For the detailed examination of HDL function and its relationship to metabolic state, see the post on [HDL function →]
Endothelial Dysfunction: Where Cardiovascular Risk Actually Begins
Atherosclerosis does not begin with high cholesterol. It begins with endothelial dysfunction — the breakdown of the single-cell layer lining arterial walls that normally acts as a selective barrier, a regulator of vascular tone, and an anti-inflammatory surface.
Healthy endothelium produces nitric oxide continuously, maintaining vascular relaxation, preventing platelet aggregation, and suppressing the inflammatory cascades that initiate atherogenesis. When endothelial function is impaired — by oxidative stress, by chronic hyperinsulinemia driving sympathetic activation, by the inflammatory cytokines produced by visceral adipose tissue and gut-derived LPS, by elevated homocysteine damaging the endothelial glycocalyx — the arterial wall becomes permeable to lipoprotein particle infiltration, adhesion molecules are upregulated, and the inflammatory sequence that produces atherosclerotic plaque begins.
In this sequence, LDL particles do not cause endothelial dysfunction. They infiltrate an endothelium that is already dysfunctional. The distinction is mechanistically and clinically important: it reframes the cardiovascular risk conversation from cholesterol lowering to endothelial protection — addressing the conditions that make the arterial wall vulnerable rather than reducing the circulating particles that exploit that vulnerability.
For the mechanisms of endothelial damage and vascular inflammation in the context of metabolic disease, see the posts on [endothelial damage →] and [vascular inflammation →]
Statins: What They Do and What They Do Not
Statins are the most prescribed class of medications in the world and their cardiovascular benefit in secondary prevention — in patients who have already had a cardiovascular event — is supported by a substantial body of evidence. That evidence deserves respect and should not be dismissed.
What the evidence does not support is the extrapolation of secondary prevention benefit to primary prevention in metabolically healthy individuals with elevated LDL but no established cardiovascular disease, particularly when the metabolic context of that LDL elevation has not been assessed. The number needed to treat in primary prevention statin trials is substantially higher than most patients are told when the prescription is written — and the metabolic trade-offs of statin therapy are rarely part of the conversation.
Statins inhibit HMG-CoA reductase — the rate-limiting enzyme in the mevalonate pathway. That pathway produces not only cholesterol but also CoQ10, dolichols, and other isoprenoid compounds essential for mitochondrial function, protein glycosylation, and cellular energy production. Statin-induced CoQ10 depletion impairs mitochondrial function in skeletal muscle, contributing to the myopathy and fatigue that many patients attribute to aging rather than medication.
More significantly for metabolic medicine, statin use is associated with a 10 to 46 percent increased risk of new-onset type 2 diabetes depending on the statin, dose, and population studied — a finding that has been consistent across multiple large trials and meta-analyses and that has a plausible mechanistic explanation through impaired mitochondrial glucose metabolism in pancreatic beta cells and skeletal muscle.
The clinical implication is direct: prescribing a statin to an insulin-resistant patient with elevated LDL without addressing the metabolic dysfunction driving the lipid pattern may lower the LDL number while worsening the metabolic disease that is the more consequential cardiovascular risk driver. The Minnesota Coronary Experiment demonstrated at population scale what this clinical logic suggests at the individual level: lowering a lipid marker is not the same as reducing the underlying risk.
For the detailed clinical examination of statin mechanisms, metabolic trade-offs, and the evidence base for their use in different patient populations, see the post on [statins and metabolic trade-offs →]
Hypertension as a Metabolic Disease
Elevated blood pressure is almost universally framed as a sodium problem in standard clinical practice. The evidence behind that framing is substantially weaker than its clinical adoption suggests, and the upstream hormonal drivers of hypertension are almost never addressed in a standard medical appointment.
Hyperinsulinemia drives blood pressure elevation through three independent mechanisms: activation of the sympathetic nervous system, stimulation of renal sodium retention through the renin-angiotensin-aldosterone system, and promotion of vascular smooth muscle proliferation that reduces arterial compliance. Magnesium deficiency — endemic in populations eating ultra-processed diets — impairs vascular smooth muscle relaxation. Vitamin D insufficiency dysregulates the renin-angiotensin system. Elevated homocysteine damages vascular endothelium. Visceral adiposity generates adipokine-driven endothelial dysfunction. These are the upstream drivers of the hypertension that most patients are given an antihypertensive to manage without any investigation of what is producing it.
The clinical observation that blood pressure normalizes as fasting insulin comes down — without any change in sodium intake — is consistent with this mechanistic framework and is one of the most reliable markers of genuine metabolic recovery in hypertensive insulin-resistant patients.
For the detailed examination of hypertension as a downstream consequence of metabolic dysfunction, see the post on [hypertension and metabolic disease →]

The Animal-Based Protocol for Insulin Resistance and Type 2 Diabetes
A Functional Medicine Framework
Reading the Full Metabolic Lipid Picture
Standard lipid panels report total cholesterol, LDL-C, HDL-C, and triglycerides. Against the mechanistic framework described across this page, those four numbers — interpreted through conventional reference ranges by a clinician who has not measured fasting insulin, ApoB, hsCRP, or homocysteine — provide an incomplete cardiovascular risk picture.
The markers that together constitute a meaningful metabolic cardiovascular assessment are:
Fasting insulin and HOMA-IR — the upstream hormonal driver of the atherogenic dyslipidemia pattern. Triglycerides and the TG/HDL ratio — the most accessible practical proxy for insulin resistance on a standard lipid panel. ApoB — the direct measurement of atherogenic particle number that LDL-C approximates but does not measure precisely. Lp(a) — a genetically determined independent cardiovascular risk factor that warrants at least one measurement in every patient’s lifetime. hsCRP — the systemic inflammatory signal that reflects the vascular environment in which lipoprotein particles are operating.
Homocysteine — the endothelial damage marker that connects B12 and folate status to vascular risk. Vitamin D and magnesium — the micronutrient variables that directly affect vascular function and insulin sensitivity. Liver enzymes ALT and GGT — reflecting the hepatic metabolic stress that drives VLDL overproduction and atherogenic dyslipidemia.
These markers together tell the story that a standard lipid panel cannot: not just what the cholesterol number is, but what metabolic system is producing it, what vascular environment it is operating in, and what interventions address the upstream mechanism rather than the downstream number.
People Also Ask
Is high cholesterol dangerous?
Cholesterol elevation requires clinical context to assess meaningfully. Elevated LDL in the presence of insulin resistance, high triglycerides, elevated ApoB, systemic inflammation, and endothelial dysfunction carries a substantially different risk profile than elevated LDL in a metabolically healthy individual with optimal fasting insulin, low hsCRP, and normal TG/HDL ratio. The number alone is insufficient for risk assessment.
What is the difference between LDL and ApoB?
LDL-C measures the cholesterol content carried by LDL particles. ApoB measures the number of atherogenic lipoprotein particles directly, since each particle carries exactly one ApoB molecule. Two patients with identical LDL-C can have dramatically different ApoB concentrations — and therefore dramatically different particle burdens and cardiovascular risk profiles — particularly in the context of insulin resistance where small dense LDL particles are prevalent.
What does the TG/HDL ratio tell you?
The TG/HDL ratio — triglycerides divided by HDL in mg/dL units — is the most accessible practical proxy for insulin resistance on a standard lipid panel. A ratio above 2.0 reliably identifies the insulin-resistant lipid phenotype. It is also a sensitive marker of metabolic recovery, falling reliably as insulin sensitivity is restored through dietary and lifestyle intervention.
Do statins cause diabetes?
Statin use is associated with a statistically significant increased risk of new-onset type 2 diabetes across multiple large trials and meta-analyses. The mechanism is plausible — statin-induced impairment of mitochondrial function through CoQ10 depletion affects both skeletal muscle glucose disposal and pancreatic beta cell function. The clinical significance of this trade-off depends on the patient’s baseline metabolic risk and the strength of their indication for statin therapy.
What causes high triglycerides?
Elevated triglycerides are primarily a hepatic insulin resistance problem rather than a dietary fat problem. When the liver becomes insulin resistant, it overproduces VLDL-triglycerides through accelerated de novo lipogenesis from excess carbohydrate substrate. Reducing insulin load through dietary change — particularly elimination of refined carbohydrates, HFCS, and frequent eating — lowers triglycerides more reliably and more substantially than reducing dietary fat.
What is the Minnesota Coronary Experiment?
The Minnesota Coronary Experiment was a large randomized controlled trial conducted between 1968 and 1973 that tested whether replacing saturated fat with linoleic acid-rich vegetable oil reduced cardiovascular mortality. The intervention successfully lowered serum cholesterol but did not reduce cardiovascular mortality — and in the trial’s own data, greater cholesterol reduction was associated with higher mortality. The results were not published until 2016, when the original data was recovered and published in the BMJ by NIH researchers. It is one of the most important pieces of evidence challenging the diet-heart hypothesis.
Why does blood pressure improve when insulin resistance is treated?
Hyperinsulinemia drives blood pressure elevation through sympathetic nervous system activation, renal sodium retention, and vascular smooth muscle proliferation. As insulin sensitivity is restored through dietary and lifestyle intervention, these hormonal drivers resolve — and blood pressure normalizes independently of sodium intake in many patients.
About the Author
Morteza Ariana is a State-Certified Functional Nutritionist based in Germany, specializing in insulin resistance, type 2 diabetes, and root-cause metabolic restoration. He holds advanced training in systems-based physiology and has worked with patients across the U.S. and Europe for over 10 years.
His clinical framework is built around a core principle that mainstream medicine consistently overlooks: chronically elevated insulin — not blood glucose — is the earliest and most actionable driver of metabolic disease. That conviction was shaped in part by his own experience with hyperinsulinemia in 2016, and deepened through a decade of clinical practice and the study of leading researchers in metabolic medicine including Benjamin Bikman, Joseph Kraft, Gerald Reaven, Jason Fung, and Stephen Phinney.
His work focuses on identifying and correcting the upstream metabolic signals — insulin load, liver-gut axis dysfunction, circadian misalignment, and micronutrient gaps — that standard screening misses entirely. Patient outcomes are documented, anonymized, and published on this site.
If this resonates, the next step is clarity
The Metabolic Restoration Blueprint is a structured 12-week framework designed to correct upstream metabolic drivers — not just manage symptoms.
Scientific References
- Ramsden CE, Zamora D, Majchrzak-Hong S, et al. Re-evaluation of the traditional diet-heart hypothesis: analysis of recovered data from Minnesota Coronary Experiment. BMJ. 2016;353:i1246. 🔗 https://pubmed.ncbi.nlm.nih.gov/27071971/
- Siri-Tarino PW, Sun Q, Hu FB, Krauss RM. Meta-analysis of prospective cohort studies evaluating the association of saturated fat with cardiovascular disease. Am J Clin Nutr. 2010;91(3):535–546. 🔗 https://pubmed.ncbi.nlm.nih.gov/20071648/
- Sniderman AD, Williams K, Contois JH, et al. A meta-analysis of low-density lipoprotein cholesterol, non-high-density lipoprotein cholesterol, and apolipoprotein B as markers of cardiovascular risk. Circ Cardiovasc Qual Outcomes. 2011;4(3):337–345. 🔗 https://pubmed.ncbi.nlm.nih.gov/21487090/
- Reaven GM. Banting lecture 1988: role of insulin resistance in human disease. Diabetes. 1988;37(12):1595–1607. 🔗 https://pubmed.ncbi.nlm.nih.gov/3056758/
- Krauss RM. Lipoprotein subfractions and cardiovascular disease risk. Curr Opin Lipidol. 2010;21(4):305–311. 🔗 https://pubmed.ncbi.nlm.nih.gov/20531184/
- Sattar N, Preiss D, Murray HM, et al. Statins and risk of incident diabetes: a collaborative meta-analysis of randomised statin trials. Lancet. 2010;375(9716):735–742. 🔗 https://pubmed.ncbi.nlm.nih.gov/20167359/
- Ridker PM, Danielson E, Fonseca FA, et al. Rosuvastatin to prevent vascular events in men and women with elevated C-reactive protein. N Engl J Med. 2008;359(21):2195–2207. 🔗 https://pubmed.ncbi.nlm.nih.gov/18997196/
- Libby P, Ridker PM, Hansson GK. Progress and challenges in translating the biology of atherosclerosis. Nature. 2011;473(7347):317–325. 🔗 https://pubmed.ncbi.nlm.nih.gov/21593864/
- Mensink RP, Zock PL, Kester AD, Katan MB. Effects of dietary fatty acids and carbohydrates on the ratio of serum total to HDL cholesterol and on serum lipids and apolipoproteins. Am J Clin Nutr. 2003;77(5):1146–1155. 🔗 https://pubmed.ncbi.nlm.nih.gov/12716665/
- Steinberg D. The cholesterol wars: the skeptics vs the preponderance of evidence. J Lipid Res. 2012;53(3):392–393. 🔗 https://pubmed.ncbi.nlm.nih.gov/22234729/
- McLaughlin T, Reaven G, Abbasi F, et al. Is there a simple way to identify insulin-resistant individuals at increased risk of cardiovascular disease? Am J Cardiol. 2005;96(3):399–404. 🔗 https://pubmed.ncbi.nlm.nih.gov/16054467/
- Grundy SM. Small LDL, atherogenic dyslipidemia, and the metabolic syndrome. Circulation. 1997;95(1):1–4. 🔗 https://pubmed.ncbi.nlm.nih.gov/8994409/
- Ravnskov U, Diamond DM, Hama R, et al. Lack of an association or an inverse association between low-density-lipoprotein cholesterol and mortality in the elderly. BMJ Open. 2016;6(6):e010401. 🔗 https://pubmed.ncbi.nlm.nih.gov/27292972/
- Flock MR, Kris-Etherton PM. Dietary saturated fat and cardiovascular disease risk: controversies and the need for better-designed studies. Curr Atheroscler Rep. 2011;13(6):499–508. 🔗 https://pubmed.ncbi.nlm.nih.gov/21968914/