
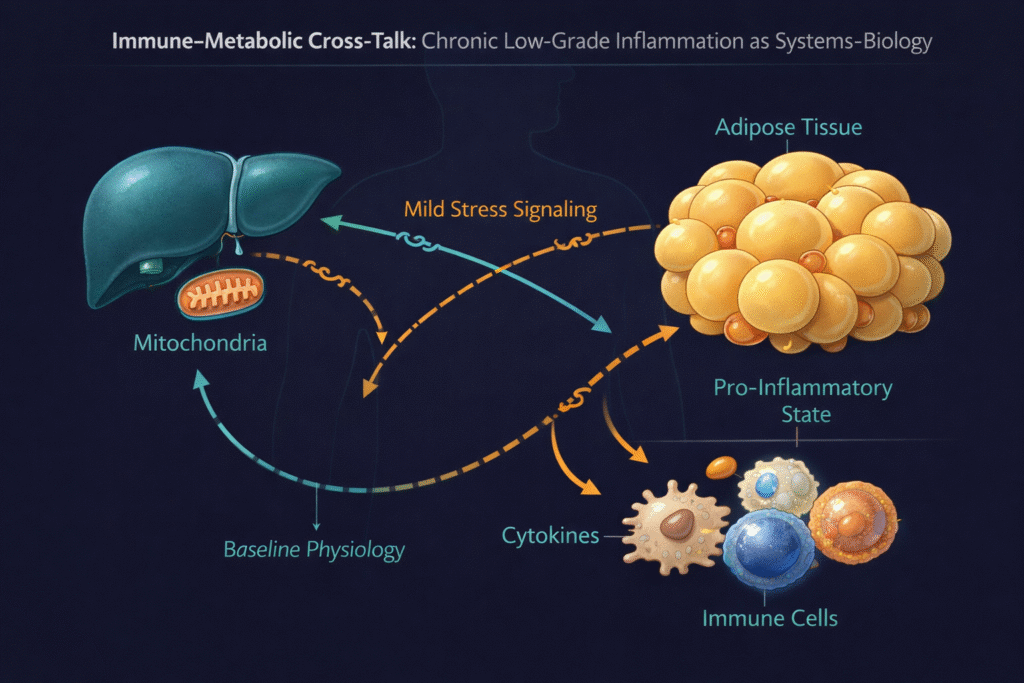
Chronic low-grade inflammation is one of the most underappreciated drivers of metabolic dysfunction in clinical practice. It is not the acute, visible inflammation of a sprained ankle or an infected wound. It is the persistent, low-amplitude inflammatory state that operates silently in the background of modern life — driven by ultra-processed food, sleep fragmentation, gut barrier dysfunction, visceral adiposity, and chronic stress. It does not produce symptoms a patient can name. It produces a slow, biochemically measurable shift in cellular function that compounds insulin resistance through pathways operating independently of carbohydrate intake or body weight.
This independence is what makes chronic low-grade inflammation clinically important. A patient can restrict carbohydrates, lose weight, exercise consistently, and still struggle with persistently elevated fasting insulin and rising HOMA-IR if their inflammatory burden has not been addressed. The conventional framework — which treats inflammation as a downstream consequence of obesity and metabolic syndrome — misses this directional relationship. Inflammation is not just a consequence of insulin resistance. It is also a cause.
In my clinical practice in Germany, hs-CRP is one of the most useful single markers I can request. It is inexpensive, widely available, and provides direct information about systemic inflammatory tone. And it is almost never interpreted against functional thresholds in standard care. The conventional cutoff of “below 3 mg/L is fine” misses the same compensatory window we have seen across every other marker in this clinical framework — the years-long phase during which dysfunction is operating but conventional readings report normal.
This article explains what chronic low-grade inflammation actually is, the functional threshold framework I use for hs-CRP, the mechanistic drivers I see most consistently in patients, the cellular pathway by which inflammation blocks insulin signaling at the receptor level, and a documented clinical case in which reducing inflammation produced significant improvement in insulin sensitivity without weight loss or aggressive carbohydrate restriction.
What you will learn: What chronic low-grade inflammation is and how it differs from acute inflammation | The functional hs-CRP threshold framework — and why conventional cutoffs miss the dysfunction | The five major drivers of inflammation in clinical practice | The cellular mechanism by which inflammation impairs insulin signaling at the receptor level | A documented case showing inflammation as an independent driver of insulin resistance
Clinical Perspective: What I See in Practice
The patient who first introduced me to the clinical importance of chronic low-grade inflammation was not the obese diabetic. It was the lean, active, conscientiously-eating patient with mildly elevated fasting insulin who could not understand why their labs were not improving despite doing all the conventional right things. Their carbohydrate intake was moderate. Their body weight was stable. Their exercise was regular. And their established metabolic dysfunction was operating anyway. The missing variable, repeatedly, was inflammation.
When I read hs-CRP, I do not use the conventional risk categories. The standard framework classifies hs-CRP below 1 mg/L as low risk, 1–3 mg/L as moderate, and above 3 mg/L as high. This is too permissive from a functional perspective. The framework I use in clinical practice runs earlier:
Below 0.5 mg/L is physiologically quiet — the inflammatory tone is genuinely low.
0.5 to 1.0 mg/L is an early signal — not benign, not yet clinically alarming, but indicating that the inflammatory baseline has begun to rise. Worth tracking and worth questioning the dietary, sleep, and stress drivers.
1.0 to 2.0 mg/L is active low-grade inflammation. The inflammatory state is mechanistically operating at a level that compounds insulin resistance, impairs cellular function, and drives metabolic dysfunction. Most patients in this range have no overt symptoms.
Above 2.0 mg/L is clinically relevant inflammation — a substantial driver of metabolic dysfunction that should be addressed directly through targeted intervention, not just managed downstream.
The critical insight is that chronic metabolic disease frequently progresses within the 0.7 to 2.0 mg/L range for years before triggering any conventional clinical reaction. A patient with an hs-CRP of 1.3 mg/L alongside otherwise normal-appearing labs is not in a reassuring position. They are in an active inflammatory state that is silently compounding whatever insulin resistance is operating underneath.
In clinical practice, inflammation is rarely attributable to a single factor. It arises from a layered interplay of contributors. The most common stack of drivers I observe across patients runs through five major categories:
Ultra-processed foods and industrial fats. High omega-6 load from seed oils, lipid peroxidation products, and postprandial endotoxemia from the gut response to highly processed food matrices. This is mechanistically the most consistent driver in my patient population.
Gut barrier dysfunction. Often clinically silent — meaning no overt gastrointestinal symptoms — but producing lipopolysaccharide translocation from gram-negative gut bacteria into systemic circulation, triggering low-grade immune activation through toll-like receptor 4 signaling. The gut-liver axis is one of the most consistent inflammatory contributors I see in patients whose dysfunction does not respond to dietary intervention alone.
Visceral adiposity. Present even in seemingly lean individuals. The visceral adipose compartment is not metabolically inert tissue. It is an actively secretory inflammatory organ, producing adipokines including TNF-alpha and IL-6 and harboring macrophage infiltration that sustains chronic inflammatory signaling. For the deeper mechanism, the dedicated post on visceral fat covers this in detail.
Sleep fragmentation and chronic stress. Cortisol dysregulation, sustained sympathetic activation, and impaired inflammatory resolution pathways. These drivers are particularly underappreciated in clinical practice because they fall outside the dietary framework most patients arrive expecting. A patient with excellent diet and chronic poor sleep can have a higher hs-CRP than a patient with mediocre diet and good sleep.
Hepatic overload. Fat accumulation in the liver, oxidative stress, and the resulting cytokine signaling that contributes to systemic inflammatory tone. Hepatic inflammation is both consequence and cause of broader metabolic dysfunction.
These five drivers operate in combination. Most patients in active inflammatory states are layering two or three of them. The diagnostic question is not which single driver is responsible — it is which combination is operating and which intervention will address the largest contributor first.
The clinical significance of inflammation is not just that it is present alongside metabolic dysfunction. It is that inflammation biochemically blocks the insulin signal at the cellular level. Pro-inflammatory cytokines, notably TNF-alpha and IL-6, activate intracellular kinases including the JNK and IKK-beta pathways. These kinases induce serine phosphorylation of insulin receptor substrate-1 (IRS-1), aberrantly replacing the normal tyrosine phosphorylation that insulin signaling requires.
This modification directly impairs downstream insulin signaling — reduced PI3K/Akt activation, impaired GLUT4 translocation in muscle cells, diminished glycogen synthesis. At the hepatic level, the same inflammatory cascade prevents insulin from effectively suppressing gluconeogenesis while paradoxically allowing lipogenesis to continue, producing the classic clinical picture of high glucose coupled with high triglyceride physiology.
This is not correlation. It is mechanism. Inflammation does not just travel alongside hyperinsulinemia — it produces it, by blocking insulin signaling at the receptor level and forcing the pancreas to compensate.
The clinical implication is that targeted reduction of inflammatory tone can improve insulin sensitivity even when body weight, body composition, and macronutrient intake remain unchanged. This is the opposite of what most patients are taught to expect from their interventions. It is also one of the most useful clinical levers available — because the dietary, sleep, and stress changes that reduce inflammation are accessible interventions that produce measurable improvement in fasting insulin and HOMA-IR within weeks to months.
A Clinical Case: Inflammation as Independent Driver
A documented case from my practice illustrates the independence of the inflammatory pathway from caloric and carbohydrate-based mechanisms. The patient was a man in his early 50s, physically active, not overtly overweight. His chief complaint was unexplained fatigue, a stalled fitness trajectory despite consistent training, and lab values that his GP had described as “borderline but acceptable.”
His presenting labs, in functional reading, were anything but acceptable.
Baseline Labs and Clinical Picture
| Marker | Baseline value | Functional interpretation |
|---|---|---|
| hs-CRP | 1.8 mg/L | Active low-grade inflammation |
| Fasting insulin | 14 µU/mL | Substantial compensatory hyperinsulinemia |
| Fasting glucose | 92 mg/dL | Conventionally normal; compensation intact |
| HOMA-IR | ~3.2 | Established insulin resistance |
| Triglycerides | 143 | Consistent with hepatic insulin resistance |
| HDL | 47 | Consistent with the TG/HDL pattern |
| Body weight | Within healthy BMI | Not flagged by conventional screening |
| Visible body composition | Lean, slight central adiposity | Not flagged by conventional screening |
The patient’s history added the clinical context the labs alone did not capture. Poor sleep — fragmented, averaging less than six hours. High chronic work stress. Frequent consumption of ultra-processed convenience foods despite no major dietary excesses on a calorie basis. Subtle gastrointestinal symptoms — bloating, irregular bowel patterns — that he had never mentioned to his GP because he did not consider them significant.
This is the classic clinical pattern of inflammation-driven insulin resistance in a lean active patient. The conventional reading would emphasize the borderline-normal glucose and the normal body weight. The functional reading recognizes that an hs-CRP of 1.8 mg/L combined with a fasting insulin of 14 µU/mL in a lean active man with poor sleep and ultra-processed food exposure represents an active inflammatory state producing measurable insulin resistance — and that the inflammation is the upstream driver, not the downstream consequence.
The Intervention
The intervention was deliberately not built around weight loss or aggressive carbohydrate restriction. The clinical hypothesis was that addressing the inflammatory drivers directly would improve insulin sensitivity without requiring the kind of macronutrient intervention most patients arrive expecting. The intervention focused on five specific changes:
Removal of ultra-processed foods and industrial seed oil exposure. Targeted elimination, not general “eat healthier” guidance. Specific foods identified and removed.
Restoration of meal structure. Three meals per day, no constant grazing, deliberate fasting windows overnight. The constant snacking pattern was identified as a significant insulin and inflammatory driver independent of total caloric intake.
Sleep regularity prioritized. Consistent bedtime, screen elimination 60 minutes before sleep, dark sleeping environment, magnesium supplementation. Sleep duration and quality treated as a clinical intervention, not lifestyle advice.
Basic gut support. Removal of the specific irritants that were producing the bloating symptoms, addition of fermented foods, simple dietary structure that allowed gut barrier recovery.
No aggressive carbohydrate restriction. Carbohydrate intake remained moderate. Whole-food carbohydrate sources, no ketogenic protocol, no calorie-counting framework. The intervention was about removing inflammatory triggers, not about manipulating macronutrients.
The intervention ran 12 to 16 weeks. The patient was tracked across consistent lab parameters at baseline and at the follow-up draw.
Outcomes at 12-16 Weeks
| Marker | Baseline | Follow-up | Change |
|---|---|---|---|
| hs-CRP | 1.8 mg/L | 0.7 mg/L | -61% (entered the “early signal” range from “active inflammation”) |
| Fasting insulin | 14 µU/mL | 8 µU/mL | -43% (substantial reduction in compensatory hyperinsulinemia) |
| Fasting glucose | 92 mg/dL | 90 mg/dL | Essentially unchanged |
| HOMA-IR | ~3.2 | ~1.8 | -44% (moved from established resistance to the emerging dysfunction range) |
| Body weight | Stable | Stable | No meaningful change |
| Body composition | Stable | Stable | No meaningful change |
| Reported energy | Fatigued | Substantially improved | Subjective improvement consistent with the labs |
| Sleep quality | Fragmented | Restored | Functional improvement |
The clinical reading of this outcome is the central teaching of this post. The patient’s body weight did not change. His macronutrient intake did not undergo aggressive restructuring. He did not enter ketosis or pursue significant carbohydrate restriction. The pivotal change was a reduction in inflammatory tone — driven by ultra-processed food elimination, sleep restoration, gut support, and meal structure.
The fasting insulin dropped 43%. The HOMA-IR dropped 44%. The hs-CRP dropped 61%. These improvements occurred independent of weight loss and independent of macronutrient manipulation. The mechanism was the restoration of insulin signaling at the cellular level, made possible by reducing the inflammatory burden that had been blocking that signaling through the JNK/IKK-beta pathway.
This is the central clinical teaching: inflammation is not merely a consequence of insulin resistance. It is an independent and potent driver of it. Targeted reduction of inflammatory signaling often produces a disproportionate improvement in insulin sensitivity, even when body weight and macronutrient intake remain essentially unchanged. The implication is direct: a patient who is doing all the conventional dietary right things but is not seeing metabolic improvement may have an unaddressed inflammatory burden as the limiting factor.
How Chronic Low-Grade Inflammation Differs From Acute Inflammation
The inflammation that drives chronic disease is mechanistically different from the inflammation that follows an acute injury or infection. Understanding this distinction is what allows the clinical framework to make sense.
Acute inflammation is the immune system’s response to a specific, time-limited insult. A cut, a sprain, an infection. The response involves recognizable signs — redness, heat, swelling, pain, functional impairment of the affected tissue. It is highly orchestrated, peaks within hours to days, and resolves as the underlying insult is cleared. Acute inflammation is a feature of normal immune function, not a disease state.
Chronic low-grade inflammation is fundamentally different. It does not respond to a specific insult. It does not produce recognizable symptoms. It does not resolve. It operates at a low amplitude — measurable in serum biomarkers like hs-CRP, IL-6, and TNF-alpha — but below the threshold that produces the classical signs of acute inflammation. It persists for months, years, or decades. And it shifts cellular function across multiple organ systems in ways that compound metabolic, cardiovascular, neurodegenerative, and cancer risk.
The biochemical signature of chronic low-grade inflammation is sustained elevation of pro-inflammatory cytokines — TNF-alpha, IL-6, IL-1-beta — produced by activated immune cells, adipose tissue macrophages, and stressed hepatocytes. These cytokines circulate at low concentrations but operate continuously, exposing every cell in the body to a slightly elevated inflammatory tone. The cells respond by shifting their metabolic and signaling functions in ways that, over time, produce the cluster of dysfunctions we recognize as metabolic syndrome, atherosclerosis, neurodegenerative disease, and aging-related decline.
The acute inflammatory response is a fire that flares and resolves. The chronic low-grade inflammatory state is a fire that has been left burning low for years, doing damage that is too slow to be alarming and too persistent to be ignored.
The Cellular Mechanism: How Inflammation Blocks Insulin Signaling
The cellular pathway by which inflammation impairs insulin signaling is one of the most mechanistically well-characterized phenomena in metabolic medicine. Understanding it explains why inflammation operates as an independent driver of insulin resistance.
Normal insulin signaling proceeds through a specific sequence. Insulin binds to its receptor on the cell surface. The receptor activates a tyrosine kinase that phosphorylates insulin receptor substrate-1 (IRS-1) on tyrosine residues. The tyrosine-phosphorylated IRS-1 then activates phosphoinositide 3-kinase (PI3K), which activates Akt, which drives GLUT4 translocation to the cell membrane in muscle and adipose cells, glycogen synthesis, and suppression of hepatic gluconeogenesis. This is the canonical insulin signaling pathway. When it operates normally, glucose enters cells efficiently and the pancreas can maintain glucose homeostasis with low insulin output.
Chronic low-grade inflammation interrupts this pathway at a specific molecular step. The pro-inflammatory cytokines TNF-alpha and IL-6 — secreted by activated macrophages, dysfunctional adipocytes, and stressed hepatocytes — activate two intracellular serine/threonine kinases: c-Jun N-terminal kinase (JNK) and the inhibitor of nuclear factor kappa-B kinase subunit beta (IKK-beta). These kinases do something specific and pathological. They phosphorylate IRS-1 on serine residues instead of allowing the normal tyrosine phosphorylation to proceed.
This serine phosphorylation has the effect of disabling IRS-1. The molecule that is supposed to transmit the insulin signal from the receptor into the cell is now chemically modified in a way that blocks signal transmission. PI3K activation is reduced. Akt activation is reduced. GLUT4 translocation in muscle cells is impaired. Glycogen synthesis is diminished. In the liver, insulin’s normal suppression of gluconeogenesis is blocked — so the liver continues producing glucose despite elevated insulin — while lipogenesis is allowed to continue, producing the characteristic clinical picture of elevated glucose alongside elevated triglycerides.
The cell, in effect, has become deaf to insulin’s signal — not because the insulin is absent, not because the receptor is defective, but because the downstream signaling molecule has been chemically silenced by inflammatory kinases. The pancreas responds by producing more insulin to overcome the resistance. The compensation works for a while. Inflammation remains in place. The cycle continues.
This mechanism is what makes inflammation an independent driver of insulin resistance. The blockade operates at the cellular signaling level, downstream of insulin and the insulin receptor. Reducing the inflammatory drivers reduces the JNK and IKK-beta activation, restores the balance toward tyrosine phosphorylation of IRS-1, and allows normal insulin signaling to resume — without requiring any change in body weight, body composition, or macronutrient intake.
This is why the case I documented earlier showed substantial improvement in fasting insulin and HOMA-IR without weight loss. The intervention reduced the inflammatory drivers. The drivers reduced the JNK/IKK-beta activation. The activation reduced the inappropriate serine phosphorylation. The IRS-1 returned to functioning correctly. The insulin signal resumed transmission. The pancreas reduced its compensatory output. The fasting insulin fell. The HOMA-IR fell with it.
The Five Drivers in Practice
The functional intervention framework follows directly from the five major drivers identified in clinical practice. Addressing each one reduces the inflammatory burden through distinct but converging mechanisms.
Ultra-processed food and industrial fat elimination is the most direct intervention. The omega-6 fatty acids in industrial seed oils — linoleic acid in particular — produce oxidized lipid species that drive inflammatory signaling. The food matrix of ultra-processed products promotes postprandial endotoxemia. Eliminating these dietary exposures reduces the inflammatory baseline measurably within weeks.
Gut barrier restoration addresses the lipopolysaccharide translocation that operates as a continuous inflammatory stimulus. The intervention is not about specific probiotics in most cases — it is about removing the foods, medications, and behaviors that are damaging the gut barrier, and providing the basic nutritional substrate (adequate protein, fiber where tolerated, fermented foods, sufficient micronutrients) that the gut needs to maintain integrity. For the deeper mechanistic picture, the dedicated leaky gut post covers this in detail.
Visceral adiposity reduction addresses the adipose-derived cytokine signaling. This intervention does require body composition change — but specifically the visceral compartment, not necessarily total body weight. Resistance training, walking, time-restricted eating, and sleep optimization all reduce visceral fat preferentially over subcutaneous fat. Weight does not need to change for visceral adiposity to reduce meaningfully.
Sleep restoration and stress management address the cortisol-mediated and sympathetic drivers of inflammation. The intervention is structural: consistent sleep timing, sleep duration of at least seven hours, deliberate stress reduction practices, and reduction of the chronic stressors that are within the patient’s control. These changes produce measurable improvement in inflammatory markers without any dietary intervention.
Hepatic burden reduction addresses the inflammatory signaling from the liver itself. This overlaps with the carbohydrate and fructose reduction discussed in hyperinsulinemia but also includes alcohol elimination, removal of hepatically-taxing medications where clinically appropriate in consultation with prescribing physicians, and the broad anti-inflammatory dietary pattern that allows hepatic recovery.
These interventions reinforce each other. A patient who addresses all five typically sees hs-CRP improvement within 6 to 12 weeks, with parallel improvements in fasting insulin, HOMA-IR, TG/HDL ratio, and subjective energy. The metabolic improvement is downstream of the inflammatory reduction.
A Note on Uncertainty
The functional threshold framework for hs-CRP described in this article — below 0.5 mg/L as quiet, 0.5 to 1.0 as early signal, 1.0 to 2.0 as active inflammation, above 2.0 as clinically relevant — is derived from clinical observation and the broader inflammation research literature. It is not codified in conventional clinical guidelines, which continue to use the categorical framework of below 1, 1 to 3, and above 3 mg/L as their primary cutoffs.
Individual variability is real. hs-CRP can be acutely elevated by recent infection, dental work, minor injuries, vaccination, and a number of other transient factors. A single elevated reading does not necessarily indicate chronic inflammation — it may indicate acute inflammation that will resolve. The clinical question is whether the elevation is sustained across multiple measurements over weeks to months.
The cellular mechanism described — JNK and IKK-beta activation, serine phosphorylation of IRS-1, impaired PI3K/Akt signaling, reduced GLUT4 translocation — is well-established in the research literature. The clinical implication, that reducing inflammation improves insulin sensitivity independent of weight loss, is supported by multiple intervention studies and consistent with the case data from my practice. The magnitude of improvement varies between patients depending on which drivers are most active and how completely they can be addressed.
The framework presented here is one I have found clinically reliable across many patients. It is not the only framework in use. For the specific question of identifying chronic low-grade inflammation as a driver of insulin resistance before it has produced overt disease, this framework is substantially more useful than conventional CRP interpretation.
Practical Implications
If your most recent blood panel includes hs-CRP, look at the value through the functional framework. A reading between 1.0 and 2.0 mg/L is not benign — it indicates active low-grade inflammation that is likely operating as a driver of whatever metabolic dysfunction is present. A reading between 0.5 and 1.0 mg/L is an early signal that warrants attention to the dietary, sleep, and gut drivers.
If your panel does not include hs-CRP, request it at your next blood draw. It is inexpensive, widely available, and provides direct information about systemic inflammatory tone that no other standard marker captures as cleanly.
If your fasting insulin or HOMA-IR is elevated despite consistent dietary effort, body weight management, and exercise, consider that an unaddressed inflammatory burden may be the limiting factor. The interventions that reduce inflammation — ultra-processed food elimination, sleep restoration, gut support, meal structure, visceral fat reduction — operate through pathways distinct from carbohydrate restriction and weight loss. They can produce measurable improvement in insulin sensitivity even when other interventions have stalled.
If you are lean, active, and conscientiously eating but your labs are not what you expect, the inflammation-insulin-resistance pathway is one of the most likely explanations. The five drivers operate in patients who do not look like they should have metabolic problems. The clinical signature is exactly that mismatch — the patient who is doing the right things by conventional standards but whose biology is telling a different story.
Chronic low-grade inflammation is not a downstream consequence of insulin resistance. It is an independent and powerful driver of it. Reducing inflammatory burden can restore insulin sensitivity even before body composition changes — and identifying this pathway is what allows clinical progress in patients who have stalled on conventional interventions.
People Also Ask
What is chronic low-grade inflammation?
Chronic low-grade inflammation is a sustained, low-amplitude inflammatory state that operates persistently in the body without producing the classical signs of acute inflammation. It is measurable through serum biomarkers including hs-CRP, IL-6, and TNF-alpha but does not produce recognizable symptoms. It persists for months, years, or decades and contributes to the development of metabolic disease, cardiovascular disease, neurodegenerative conditions, and aging-related decline. Unlike acute inflammation, it does not resolve on its own — it requires identification and targeted reduction of its underlying drivers.
What is a normal hs-CRP level?
Conventional clinical thresholds classify hs-CRP below 1 mg/L as low cardiovascular risk, 1–3 mg/L as moderate, and above 3 mg/L as high. In functional metabolic practice, the more clinically useful thresholds are: below 0.5 mg/L as physiologically quiet, 0.5–1.0 mg/L as an early signal, 1.0–2.0 mg/L as active low-grade inflammation, and above 2.0 mg/L as clinically relevant. The functional thresholds catch dysfunction that conventional cutoffs miss, particularly in patients within the 0.7–2.0 mg/L range where metabolic disease often progresses for years.
How does inflammation cause insulin resistance?
Pro-inflammatory cytokines, particularly TNF-alpha and IL-6, activate intracellular kinases called JNK and IKK-beta. These kinases phosphorylate insulin receptor substrate-1 (IRS-1) on serine residues, replacing the normal tyrosine phosphorylation that insulin signaling requires. This chemical modification disables IRS-1, blocks downstream PI3K/Akt activation, impairs GLUT4 translocation in muscle cells, and prevents insulin from suppressing hepatic gluconeogenesis. The cell becomes effectively deaf to insulin’s signal despite normal insulin levels and a normal insulin receptor. This is the mechanistic basis for inflammation operating as an independent driver of insulin resistance.
Can you have inflammation without symptoms?
Yes — and this is the defining feature of chronic low-grade inflammation. The inflammatory state operates at amplitude below what produces the classical signs of acute inflammation (redness, heat, swelling, pain). Most patients with hs-CRP values in the 1.0–2.0 mg/L range have no overt symptoms. The damage is biochemical and cumulative rather than symptomatic. This is why hs-CRP screening is clinically valuable — it captures dysfunction that does not announce itself.
Can inflammation cause insulin resistance even if I am lean and active?
Yes. The inflammation-insulin resistance pathway operates independent of body weight and physical activity. A lean, active patient with poor sleep, chronic stress, ultra-processed food exposure, or gut barrier dysfunction can develop active inflammatory signaling that drives insulin resistance through the cellular mechanism described above. The case documented in this article shows exactly this pattern — a lean, active man in his early 50s whose fasting insulin and HOMA-IR improved dramatically through inflammation reduction without weight loss or significant macronutrient change.
How long does it take to reduce chronic inflammation?
Measurable reductions in hs-CRP typically occur within 6 to 12 weeks of consistent intervention addressing the major drivers — ultra-processed food elimination, sleep restoration, gut support, meal structure, and visceral fat reduction. Improvements in fasting insulin and HOMA-IR typically parallel the inflammatory improvement on a similar timeline. Some patients see meaningful changes faster, particularly when sleep and dietary changes are implemented simultaneously and consistently.
Can reducing inflammation lower fasting insulin without weight loss?
Yes. This is one of the most clinically useful findings in functional metabolic medicine. Because inflammation blocks insulin signaling at the receptor level through the JNK/IKK-beta pathway, reducing the inflammatory burden can restore cellular insulin sensitivity independent of body weight or body composition change. The case documented in this article demonstrated a 43% reduction in fasting insulin and 44% reduction in HOMA-IR over 12-16 weeks with essentially no change in body weight. The mechanism was restoration of insulin signaling, not metabolic adaptation to caloric restriction.
About the Author
Morteza Ariana is a State-Certified Functional Nutritionist based in Germany, specializing in insulin resistance, type 2 diabetes, and root-cause metabolic restoration. He holds advanced training in systems-based physiology and has worked with patients across the U.S. and Europe for over 10 years.
His clinical framework is built around a core principle that mainstream medicine consistently overlooks: chronically elevated insulin — not blood glucose — is the earliest and most actionable driver of metabolic disease. That conviction was shaped in part by his own experience with hyperinsulinemia in 2016, and deepened through a decade of clinical practice and the study of leading researchers in metabolic medicine including Benjamin Bikman, Joseph Kraft, Gerald Reaven, Jason Fung, and Stephen Phinney.
His work focuses on identifying and correcting the upstream metabolic signals — insulin load, liver-gut axis dysfunction, circadian misalignment, and micronutrient gaps — that standard screening misses entirely. Patient outcomes are documented, anonymized, and published on this site.
If this resonates, the next step is clarity
The Metabolic Restoration Blueprint is a structured 12-week framework designed to correct upstream metabolic drivers — not just manage symptoms.
Scientific References
- Hotamisligil GS. Inflammation, metaflammation and immunometabolic disorders. Nature. 2017;542(7640):177–185. 🔗 https://pubmed.ncbi.nlm.nih.gov/28179656/
- Hotamisligil GS, Shargill NS, Spiegelman BM. Adipose expression of tumor necrosis factor-alpha: direct role in obesity-linked insulin resistance. Science. 1993;259(5091):87–91. 🔗 https://pubmed.ncbi.nlm.nih.gov/7678183/
- Hirosumi J, Tuncman G, Chang L, et al. A central role for JNK in obesity and insulin resistance. Nature. 2002;420(6913):333–336. 🔗 https://pubmed.ncbi.nlm.nih.gov/12447443/
- Aguirre V, Uchida T, Yenush L, Davis R, White MF. The c-Jun NH(2)-terminal kinase promotes insulin resistance during association with insulin receptor substrate-1 and phosphorylation of Ser(307). Journal of Biological Chemistry. 2000;275(12):9047–9054. 🔗 https://pubmed.ncbi.nlm.nih.gov/10722755/
- Shoelson SE, Lee J, Goldfine AB. Inflammation and insulin resistance. Journal of Clinical Investigation. 2006;116(7):1793–1801. 🔗 https://pubmed.ncbi.nlm.nih.gov/16823477/
- Cani PD, Amar J, Iglesias MA, et al. Metabolic endotoxemia initiates obesity and insulin resistance. Diabetes. 2007;56(7):1761–1772. 🔗 https://pubmed.ncbi.nlm.nih.gov/17456850/
- Ridker PM, Buring JE, Cook NR, Rifai N. C-reactive protein, the metabolic syndrome, and risk of incident cardiovascular events: an 8-year follow-up of 14,719 initially healthy American women. Circulation. 2003;107(3):391–397. 🔗 https://pubmed.ncbi.nlm.nih.gov/12551861/
- Pradhan AD, Manson JE, Rifai N, Buring JE, Ridker PM. C-reactive protein, interleukin 6, and risk of developing type 2 diabetes mellitus. JAMA. 2001;286(3):327–334. 🔗 https://pubmed.ncbi.nlm.nih.gov/11466099/
- Festa A, D’Agostino R Jr, Howard G, Mykkänen L, Tracy RP, Haffner SM. Chronic subclinical inflammation as part of the insulin resistance syndrome: the Insulin Resistance Atherosclerosis Study (IRAS). Circulation. 2000;102(1):42–47. 🔗 https://pubmed.ncbi.nlm.nih.gov/10880413/
- Donath MY, Shoelson SE. Type 2 diabetes as an inflammatory disease. Nature Reviews Immunology. 2011;11(2):98–107. 🔗 https://pubmed.ncbi.nlm.nih.gov/21233852/
- Saltiel AR, Olefsky JM. Inflammatory mechanisms linking obesity and metabolic disease. Journal of Clinical Investigation. 2017;127(1):1–4. 🔗 https://pubmed.ncbi.nlm.nih.gov/28045402/
- DiNicolantonio JJ, O’Keefe JH. Omega-6 vegetable oils as a driver of coronary heart disease: the oxidized linoleic acid hypothesis. Open Heart. 2018;5(2):e000898. 🔗 https://pubmed.ncbi.nlm.nih.gov/30364556/
- Irwin MR, Olmstead R, Carroll JE. Sleep disturbance, sleep duration, and inflammation: a systematic review and meta-analysis of cohort studies and experimental sleep deprivation. Biological Psychiatry. 2016;80(1):40–52. 🔗 https://pubmed.ncbi.nlm.nih.gov/26140821/
- Tilg H, Moschen AR. Adipocytokines: mediators linking adipose tissue, inflammation and immunity. Nature Reviews Immunology. 2006;6(10):772–783. 🔗 https://pubmed.ncbi.nlm.nih.gov/16998510/