
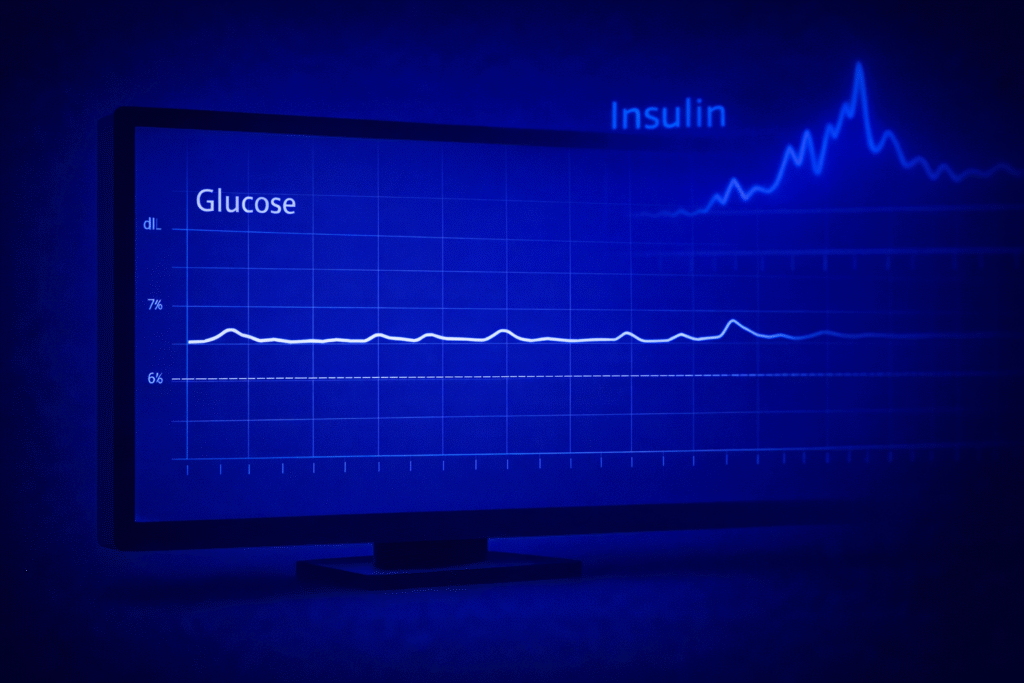
Normal blood sugar but insulin resistance already developing — this combination is far more common than most people realize, and far more dangerous than most doctors communicate. Your body can maintain perfectly normal fasting glucose for years, even decades, while insulin quietly rises higher and higher to compensate. By the time your blood sugar finally tips into the abnormal range, insulin resistance has typically been present for 10 to 15 years.
A standard blood panel can look completely normal while insulin resistance has been operating silently for years. The fasting glucose sits at 88 mg/dL. The HbA1c is 5.4%. The cholesterol numbers are within their conventional ranges. The patient is told everything is fine. And the patient leaves the appointment with a slowly progressing metabolic dysfunction that nobody will name until it has crossed a glucose-based threshold a decade later.
This is the compensatory phase of insulin resistance — the phase where the pancreas is producing increasing amounts of insulin to keep glucose in the normal range. The compensation is working. The glucose stays controlled. The standard markers used to screen for metabolic dysfunction — fasting glucose, HbA1c, BMI in many cases — all report normal. The dysfunction is real but invisible to conventional screening.
In my clinical practice in Germany, this patient is the one I worry about most. Not the obviously overweight patient with established type 2 diabetes — that diagnosis is at least named, even if the conventional management is not optimal. The patient who walks in with a normal-looking panel and the words “everything is fine” ringing in their ears is the patient whose metabolic decline could most easily have been caught early. And was not.
This article explains what the compensatory phase actually looks like, why standard screening misses it, what surrogate markers reveal it, and how to recognize it in your own labs — particularly if you fit one of the two phenotypes that conventional screening is most blind to: the lean patient and the active patient.
What you will learn: Why fasting glucose and HbA1c can stay normal for years while insulin resistance progresses | The compensatory phase and what it means physiologically | The surrogate markers that reveal hidden insulin resistance on a standard panel | The lean and active patient phenotypes that conventional screening misses entirely | How to interpret the full clinical picture when standard markers report “normal”
Clinical Perspective: What I See in Practice
The patient who concerns me most in my clinical practice is rarely the obviously overweight patient. It is the patient who looks healthy enough on paper, whose glucose has been normal or near-normal for years, whose HbA1c is still not alarming, and who has been told repeatedly by their physicians that everything is fine. Through a functional medicine lens, the pattern of established metabolic dysfunction is already operating. It is just not being read.
The structural problem is that most standard lab panels do not include fasting insulin. Without fasting insulin, the compensatory phase is invisible — the phase where glucose still looks acceptable only because the pancreas is producing more insulin to keep it that way. The blood sugar looks controlled. The cost of that control — chronically rising insulin pressure — is not measured. The patient is reassured by markers that are not capturing the actual dysfunction.
When fasting insulin is missing from the panel, I look for indirect evidence. The TG/HDL ratio is the most useful single marker available on a basic lipid panel for inferring hepatic insulin resistance. Liver enzymes — ALT and GGT in particular — locate hepatic involvement. High-sensitivity CRP captures the inflammatory layer. Waist circumference reveals visceral adiposity even in a patient with a normal BMI. Blood pressure trends matter. Uric acid is a fructose and mitochondrial stress marker. And the clinical phenotype — body composition pattern, energy across the day, post-meal fatigue, cravings, sleep quality, skin tags, family history — provides the context the lab values cannot.
A patient can be lean, active, and still have central abdominal fat, post-meal fatigue, cravings, skin tags, a tendency toward fatty liver on ultrasound, elevated triglycerides, low HDL, and subtle ALT or GGT elevation. These are the early fingerprints of hepatic insulin resistance. The patient does not look insulin resistant by any conventional definition. The body is telling the story anyway.
The frustrating part is that many standard panels in German clinical practice do not include HDL or GGT routinely. When the most useful pattern-recognition tools are missing from the panel itself, the diagnostic options become severely constrained. The clinical attention falls heavily on LDL, while the liver-insulin-triglyceride story that would actually predict the patient’s metabolic trajectory goes unmeasured.
A clinical example illustrates the pattern. Fasting glucose 105 mg/dL. HbA1c 6.4%. Triglycerides 173 mg/dL. HDL 44 mg/dL. TG/HDL ratio approximately 3.9. ALT 51 U/L. AST 47 U/L. GGT 60 U/L. Fasting insulin not measured. Body type: not overweight, but slight central adiposity.
In conventional reading, this patient is often told something close to: “Not catastrophic. Just watch it. Maybe consider some lifestyle changes.” The HbA1c is technically in the pre-diabetic range but not yet diabetic. The glucose is in the impaired fasting glucose zone but does not yet warrant pharmacological intervention. The lipids and liver enzymes are flagged but not emphasized. The conversation in the consultation room is reassuring, perhaps cautious. The patient leaves believing the situation is manageable through general advice.
A functional reading of the same panel produces an entirely different clinical conclusion. The HbA1c of 6.4% sits one step from the diabetic threshold. The fasting glucose of 105 mg/dL shows the compensatory phase is beginning to fail — glucose is rising despite continued insulin compensation. The TG/HDL ratio near 4 strongly indicates established hepatic insulin resistance. The liver enzymes are not functionally normal — they reflect hepatocellular stress consistent with fatty liver physiology, even though they are not dramatically elevated by conventional thresholds. GGT around 55-60 adds oxidative stress and hepatic detoxification burden to the picture.
This is the late compensatory window. The patient is years into insulin resistance. The pancreas is no longer keeping pace. The liver is already in established dysfunction. And the HOMA-IR calculation that would quantify this picture cannot even be performed because fasting insulin was not ordered.
The conversation with the patient at this stage has to be gentle but direct. What I typically say goes something like this: “Your glucose does not look catastrophic yet. That does not mean your metabolism is healthy. Your body may still be compensating, but the pancreas is working harder than it should to keep glucose under control. The triglyceride and HDL pattern, combined with the liver markers, suggests the liver is already insulin resistant. This is not primarily a cholesterol problem. It is an energy metabolism and liver signaling problem. The reason nobody told you this is not because they were careless — it is because the framework for reading the panel this way is not the framework most clinicians use.”
For the lean patient or the active patient — the one who has been told their whole life that they are metabolically healthy because they are not overweight — the conversation requires an additional layer. The framing I have found most effective: “You are not protected from insulin resistance just because you are not overweight. Some people store metabolic dysfunction under the skin and become visibly overweight. Others store it more internally — in the liver, visceral fat, and pancreas. That is why a lean person can still be metabolically unhealthy. Your appearance has been protecting you from being looked at properly.”
The real tragedy of this pattern is that many patients are told everything is fine until glucose finally breaks. Glucose is one of the later markers in the metabolic decline trajectory. Before glucose rises clearly on a panel, the liver has typically been operating in dysfunction for years. The window for the easiest, most complete reversal is the compensatory phase. The window the conventional system most reliably misses is also the compensatory phase. These are not coincidences — they are structural features of how metabolic dysfunction is currently screened and named in standard care.
When I tell a patient with normal-looking labs that they are actually in the late compensatory phase of insulin resistance, the reaction is not relief that we caught something. It is usually a kind of quiet disbelief — followed by a slow recognition. The patient has often noticed for years that something was not quite right. The energy patterns, the cravings, the unexplained weight gain around the middle, the post-meal fatigue, the gradual creep of certain symptoms. They were told these were normal aging, normal stress, normal life. The lab values supported that framing. The framing was wrong.
The first intervention is never a statin. The first intervention is to reduce the hepatic burden directly: remove refined carbohydrates, sugar, alcohol if present, seed-oil-heavy ultra-processed foods, late-night eating, and the chronic snacking pattern that keeps insulin elevated across the day. Increase protein quality, resistance training, walking after meals, sleep quality, and meal timing. The goal is not to make the lab numbers look better. The goal is to restore insulin signaling before the pancreas can no longer compensate. The numbers improve as a consequence of the underlying physiology improving.
How You Can Have Normal Blood Sugar but Insulin Resistance at the Same Time
The clinical thresholds used to define normal blood sugar in conventional practice were developed primarily to identify established diabetes and prediabetes, not to detect insulin resistance. Understanding this distinction is important because it explains why a patient can have normal blood sugar by every conventional measure and still be in the middle of progressive metabolic dysfunction.
The standard thresholds run roughly as follows. Fasting glucose below 100 mg/dL is considered normal. Fasting glucose 100 to 125 mg/dL is impaired fasting glucose, the prediabetic range. Fasting glucose 126 mg/dL or above on two separate occasions meets criteria for type 2 diabetes. For HbA1c, below 5.7% is conventionally normal, 5.7% to 6.4% is prediabetic, and 6.5% or above is diabetic.
These thresholds were chosen to identify patients who already have measurable glucose dysregulation. They were not designed to detect insulin resistance, which precedes glucose dysregulation by years or decades. A patient can have a fasting glucose of 88 mg/dL and an HbA1c of 5.4% — values that are flagged as fully normal by every conventional system — while operating with a fasting insulin of 18 µU/mL and a HOMA-IR of 3.9. The glucose is normal because the elevated insulin is keeping it normal. The cost of that compensation is not visible on the glucose-based markers.
This is the central problem with using glucose-based screening to assess metabolic health. Glucose is a late marker. By the time glucose dysregulation appears on a panel, the underlying insulin resistance has typically been operating in the compensatory phase for 10 to 15 years. The pancreas has been overworking. The liver has been accumulating fat. The lipid dynamics have been shifting toward the atherogenic pattern. The visceral fat has been expanding. The inflammatory signaling has been rising. All of this happens while glucose remains within the conventionally normal range — because the compensation is working.
When glucose finally rises, it is not the beginning of the disease. It is the point where the compensation has begun to fail. The window for the easiest reversal has typically passed by years. The clinical intervention is still effective but is no longer the gentle, complete reversal that was possible during the compensatory phase itself.
The Compensatory Phase: What Is Actually Happening Physiologically
Understanding the compensatory phase requires understanding what insulin is doing in the body during the years when glucose looks normal but insulin resistance is progressing.
In a metabolically healthy individual, the cells respond efficiently to small amounts of insulin. Glucose enters the cells, blood glucose stays controlled, and fasting insulin remains low — typically below 5 µU/mL. The system operates with minimal effort.
As insulin resistance begins to develop — driven by chronic dietary carbohydrate excess, physical inactivity, accumulating visceral fat, sleep disruption, chronic stress, and ultra-processed food exposure — the cells become less responsive to insulin’s signal. To overcome this resistance and maintain glucose homeostasis, the pancreas produces more insulin. The same glucose-lowering effect now requires substantially more insulin to achieve.
This is the compensatory phase. The compensation is working in the sense that blood glucose stays within the conventionally normal range. But the body is paying a metabolic price for that control. Chronic hyperinsulinemia begins to operate. The liver, exposed continuously to elevated insulin, begins to produce excess triglycerides through de novo lipogenesis. Adipose tissue, particularly visceral adipose tissue, becomes the primary storage site for the metabolic excess. Inflammatory signaling rises. Cellular insulin receptors downregulate, deepening the resistance and requiring still more insulin to maintain the same glucose control.
The compensation can sustain glucose homeostasis for years — in some patients, for over a decade. The standard glucose-based screening reports normal throughout this entire period. The patient is reassured. The dysfunction progresses.
Eventually, beta-cell capacity begins to decline. The pancreas can no longer produce the elevated insulin levels required. Insulin output begins to fall, paradoxically — even as resistance is more severe than ever. Glucose, no longer fully controlled by the failing compensation, begins to rise. The patient enters impaired fasting glucose, then prediabetes, then type 2 diabetes. By the time this happens, beta-cell function has typically been compromised by 50% or more.
The trajectory from metabolic health to type 2 diabetes is not a sudden event. It is a slow, multi-year progression through the compensatory phase. The clinical opportunity is to identify the compensatory phase while it is still operating and intervene before beta-cell exhaustion occurs.
The Surrogate Markers That Reveal Hidden Insulin Resistance
When fasting insulin is not available, the following surrogate markers on a standard panel can reveal insulin resistance that the glucose-based markers miss.
TG/HDL ratio. The most informative single calculation on a standard lipid panel. A ratio above 2.0 in mg/dL units indicates hepatic insulin resistance; above 3.0 indicates established hepatic dysfunction. This ratio can be elevated for years before glucose becomes abnormal.
ALT relative to AST. ALT disproportionately elevated relative to AST is the classic pattern of metabolic fatty liver. An ALT above 35 U/L is functionally concerning even within conventional reference ranges. The pattern reflects hepatic fat accumulation and oxidative stress consistent with insulin resistance at the liver.
GGT. Elevated GGT — above 30 U/L is the functional threshold I use — adds an oxidative stress and gut-liver axis signal. Particularly relevant when there is a history of ultra-processed food consumption, alcohol intake, or repeated antibiotic exposure.
Uric acid. Elevated uric acid (above 7 mg/dL in men, above 6 mg/dL in women) is a fructose-load marker and a mitochondrial stress marker. It frequently parallels NAFLD because fructose is metabolized in the liver and drives hepatic de novo lipogenesis.
Waist circumference. Above 94 cm in men or 80 cm in women indicates visceral adiposity, which feeds the portal vein with free fatty acids that compound hepatic insulin resistance. The lean patient with central adiposity is a specific phenotype that BMI completely misses.
High-sensitivity CRP. Elevated hs-CRP (above 1 mg/L is functionally meaningful, above 3 mg/L is concerning) indicates the chronic low-grade inflammation that compounds insulin resistance through inflammatory signaling pathways.
Blood pressure trends. Elevated insulin activates the sympathetic nervous system and promotes sodium retention. Rising blood pressure in a patient with otherwise normal glucose is often a downstream marker of insulin resistance.
When multiple markers in this list are above functional thresholds simultaneously, hidden insulin resistance is operating regardless of what the glucose-based markers report. The pattern is diagnostic even when no single marker would warrant attention by conventional standards.
The Two Phenotypes Conventional Screening Misses Most
Two specific patient phenotypes are systematically under-recognized in standard clinical care because they do not fit the visual or anthropometric profile that conventional medicine associates with metabolic dysfunction.
The lean metabolically unhealthy patient. Sometimes referred to as TOFI (thin outside, fat inside) or normal-weight metabolically obese, this phenotype describes a patient with normal BMI but central adiposity, hepatic steatosis on ultrasound, elevated TG/HDL ratio, often family history of type 2 diabetes, and rising fasting insulin despite a slim outward appearance. Some people store metabolic dysfunction under the skin and become visibly overweight. Others store it more internally — in the liver, visceral fat, and pancreas — without changing their outward shape significantly. The lean metabolically unhealthy patient is the second category. They are almost never flagged by conventional screening because their BMI and superficial appearance do not trigger the standard concerns.
The active metabolically unhealthy patient. This patient exercises regularly, often vigorously. They run, cycle, lift, or train at a recreational or competitive level. Their cardiovascular fitness is good. They believe — and are usually told — that their level of activity protects them from metabolic disease. It does not, fully. An active patient can still have an elevated TG/HDL ratio, elevated fasting insulin, hepatic insulin resistance, and the full compensatory metabolic pattern.
Exercise modulates the trajectory of insulin resistance but does not, on its own, neutralize the dietary, sleep, and stress drivers that produce it. The recreational athlete who eats high-carbohydrate post-workout meals, sleeps poorly, and lives with chronic work stress is not protected by their training alone. For the deeper mechanistic picture, the dedicated post on insulin resistance in athletes covers this phenotype in detail.
Both phenotypes are particularly vulnerable to delayed diagnosis precisely because they fall outside the visual profile conventional medicine associates with metabolic risk. They are reassured for years. The dysfunction operates throughout the reassurance.
What Improves the Compensatory Phase
The compensatory phase of insulin resistance is the most reversible window in the entire metabolic decline trajectory. Intervention at this stage typically produces meaningful improvement within weeks and substantial reversal within months. The interventions that work are the same interventions that reverse insulin resistance at any stage — but they work more completely and more quickly during the compensatory phase because beta-cell function is still intact.
Reduction of dietary refined carbohydrate and fructose load is the most direct lever. Every carbohydrate-containing meal stimulates insulin secretion. Reducing the carbohydrate burden directly reduces the insulin demand and gradually restores cellular insulin sensitivity.
Elimination of industrial seed oils, high-fructose corn syrup, and ultra-processed foods reduces the gut-liver axis inflammation that compounds hepatic insulin resistance. Their elimination produces improvement that pure carbohydrate restriction alone does not.
An animal-based, protein-forward eating pattern with adequate fat from whole-food sources supports satiety, preserves lean mass, minimizes the insulinogenic load relative to carbohydrate-based patterns, and removes the dietary drivers of the hepatic fat environment.
Time-restricted eating with an extended overnight fasting window — typically 14 to 16 hours — reduces total daily insulin exposure and allows the cellular insulin signaling pathways time to recover sensitivity.
Resistance training builds skeletal muscle mass, which is the largest single site of insulin-mediated glucose disposal. Combined with regular walking — particularly walking after meals — and adequate sleep, this addresses both the metabolic and circadian drivers of the compensation.
These interventions work because they address the upstream cause. Within 8 to 16 weeks of consistent implementation, the surrogate markers begin to shift measurably: TG/HDL ratio falls, ALT and GGT normalize, hs-CRP drops, waist circumference reduces, and — when fasting insulin is finally measured — the value typically falls back toward functional ranges.
A Note on Uncertainty
The thresholds and clinical patterns described in this article are derived from clinical observation, the broader research literature on insulin resistance progression, and the functional medicine framework I use in practice. They are not codified in conventional clinical guidelines, which continue to organize screening around glucose-based markers and BMI.
Individual variability is real. Genetic factors, ethnic differences in insulin resistance trajectory, and the specific clinical context of each patient all affect how these markers should be interpreted in any individual case. A TG/HDL ratio above 2.0 in an otherwise healthy young patient with strong family history and good clinical phenotype is a signal to investigate further — not a diagnosis. The clinical picture as a whole always matters more than any single marker.
The framework presented here is one I have found clinically reliable across hundreds of patients in functional medicine practice. It is not the only framework in use. For the specific question of detecting insulin resistance during the compensatory phase, before glucose becomes abnormal, this framework is substantially more useful than the conventional glucose-based screening approach. For documentation and communication within standard medical systems, the conventional thresholds continue to apply.
Practical Implications
If your most recent blood panel reports normal fasting glucose and normal HbA1c, this is not automatic reassurance that your metabolic health is intact. The glucose-based markers can remain normal for a decade or more while insulin resistance progresses in the background.
Calculate your TG/HDL ratio from your existing panel if both values are present. If the ratio is above 2.0 in mg/dL units, hepatic insulin resistance is operating regardless of what the glucose values show. If the ratio is above 3.0, the dysfunction is established and the intervention timeline is no longer theoretical.
Look at your ALT and GGT if they were measured. Values within the conventional reference range but above the functional thresholds I have described — ALT above 35 U/L, GGT above 30 U/L — indicate hepatic stress that is mechanistically consistent with insulin resistance.
If you have a normal BMI, do not assume you are protected. Measure your waist circumference. Above 94 cm in men or 80 cm in women indicates the central adiposity pattern that conventional screening misses.
If you are physically active, do not assume training compensates for everything. Exercise modulates the trajectory of insulin resistance but does not, on its own, neutralize the dietary, sleep, and stress drivers that produce it.
If multiple surrogate markers are above their functional thresholds — regardless of what your glucose is doing — request fasting insulin at your next blood draw. It is inexpensive, widely available, and provides the diagnostic information that the standard panel systematically fails to capture.
Normal blood sugar does not mean a normal metabolism. The compensatory phase of insulin resistance is real, common, reversible, and almost completely invisible to the screening tools conventional medicine uses to declare patients healthy. Knowing this is the precondition for catching the dysfunction at the point when intervention is still gentle and complete.
People Also Ask
Can you have insulin resistance with normal blood sugar?
Yes. This is the compensatory phase of insulin resistance, during which the pancreas produces increasing amounts of insulin to maintain normal glucose levels. The glucose stays controlled because the elevated insulin is forcing the system to compensate. The standard glucose-based markers — fasting glucose and HbA1c — report normal throughout this phase, which can last 10 to 15 years before glucose finally begins to rise. Insulin resistance is fully operative during this entire period and is fully reversible if detected.
What is the compensatory phase of insulin resistance?
The compensatory phase is the period during which the pancreas produces elevated insulin to overcome cellular resistance and keep blood glucose within the normal range. During this phase, glucose-based screening reports normal because the compensation is working. Underneath the apparently normal glucose, insulin is rising, hepatic fat is accumulating, lipid dynamics are shifting, and visceral adiposity is expanding. The compensation continues until beta-cell function begins to decline, at which point glucose finally rises.
How can I tell if I have hidden insulin resistance?
Look at the surrogate markers on your standard panel: TG/HDL ratio (above 2.0 in mg/dL is concerning), ALT and GGT (above 35 and 30 U/L respectively are functionally concerning even within conventional reference ranges), uric acid, high-sensitivity CRP, waist circumference (above 94 cm in men, 80 cm in women), and blood pressure trends. When multiple markers are above their functional thresholds, insulin resistance is operating regardless of what your glucose values show. Request fasting insulin and HOMA-IR if any combination of these markers raises suspicion.
Can a lean person be insulin resistant?
Yes, and this phenotype — sometimes called lean metabolically unhealthy or TOFI (thin outside, fat inside) — is consistently underdiagnosed by conventional screening that relies on BMI as a proxy for metabolic risk. A lean person can have central adiposity, hepatic steatosis, elevated TG/HDL ratio, and rising fasting insulin. Some people store metabolic dysfunction in visibly overweight body composition. Others store it more internally — in the liver, visceral fat, and pancreas — without changing their outward shape. The internal storage pattern is what conventional screening systematically misses.
Can an active person be insulin resistant?
Yes. Exercise modulates the trajectory of insulin resistance but does not, on its own, neutralize the dietary, sleep, and stress drivers that produce it. A recreational athlete or competitive exerciser can have elevated TG/HDL ratio, elevated fasting insulin, and the full compensatory metabolic pattern. Training is metabolically protective in important ways but does not fully compensate for high carbohydrate intake, poor sleep, chronic stress, or ultra-processed food exposure. The active patient who is told their training protects them is at risk of years of delayed diagnosis.
Why don’t doctors test for insulin resistance directly?
Standard primary care screening is built around detecting established diabetes, not preventing it. The diagnostic criteria — fasting glucose, HbA1c — were chosen to identify patients who already have measurable glucose dysregulation. Fasting insulin, which would detect insulin resistance during the compensatory phase, is not part of standard panels in most healthcare systems including Germany. The reasoning is partly historical and partly cost-driven, but the consequence is that insulin resistance is structurally invisible to conventional screening until glucose dysregulation finally appears.
Is the compensatory phase reversible?
Yes — and it is the most reversible window in the entire metabolic decline trajectory. During the compensatory phase, beta-cell function is still intact, the cellular dysfunction has not become permanent, and the underlying drivers (dietary, fasting, sleep, movement, stress) respond meaningfully to intervention within weeks to months. Surrogate markers — TG/HDL, ALT, GGT, hs-CRP, waist circumference — typically improve within 8 to 16 weeks of consistent lifestyle intervention. The window closes as beta-cell function begins to decline. The clinical opportunity is to catch the dysfunction during the compensatory phase, not after.
About the Author
Morteza Ariana is a State-Certified Functional Nutritionist based in Germany, specializing in insulin resistance, type 2 diabetes, and root-cause metabolic restoration. He holds advanced training in systems-based physiology and has worked with patients across the U.S. and Europe for over 10 years.
His clinical framework is built around a core principle that mainstream medicine consistently overlooks: chronically elevated insulin — not blood glucose — is the earliest and most actionable driver of metabolic disease. That conviction was shaped in part by his own experience with hyperinsulinemia in 2016, and deepened through a decade of clinical practice and the study of leading researchers in metabolic medicine including Benjamin Bikman, Joseph Kraft, Gerald Reaven, Jason Fung, and Stephen Phinney.
His work focuses on identifying and correcting the upstream metabolic signals — insulin load, liver-gut axis dysfunction, circadian misalignment, and micronutrient gaps — that standard screening misses entirely. Patient outcomes are documented, anonymized, and published on this site.
If this resonates, the next step is clarity
The Metabolic Restoration Blueprint is a structured 12-week framework designed to correct upstream metabolic drivers — not just manage symptoms.
Scientific References
- Reaven GM. Role of insulin resistance in human disease. Diabetes. 1988;37(12):1595–1607. 🔗 https://pubmed.ncbi.nlm.nih.gov/3056758/
- Tabák AG, Jokela M, Akbaraly TN, Brunner EJ, Kivimäki M, Witte DR. Trajectories of glycaemia, insulin sensitivity, and insulin secretion before diagnosis of type 2 diabetes: an analysis from the Whitehall II study. The Lancet. 2009;373(9682):2215–2221. 🔗 https://pubmed.ncbi.nlm.nih.gov/19515410/
- Crofts CAP, Schofield G, Zinn C, Wheldon M, Kraft J. Identifying hyperinsulinaemia in the absence of impaired glucose tolerance: an examination of the Kraft database. Diabetes Research and Clinical Practice. 2016;118:50–57. 🔗 https://pubmed.ncbi.nlm.nih.gov/27344544/
- Stefan N, Häring HU, Hu FB, Schulze MB. Metabolically healthy obesity: epidemiology, mechanisms, and clinical implications. The Lancet Diabetes & Endocrinology. 2013;1(2):152–162. 🔗 https://pubmed.ncbi.nlm.nih.gov/24622321/
- Ruderman NB, Schneider SH, Berchtold P. The “metabolically-obese,” normal-weight individual. American Journal of Clinical Nutrition. 1981;34(8):1617–1621. 🔗 https://pubmed.ncbi.nlm.nih.gov/7270486/
- Thomas EL, Frost G, Taylor-Robinson SD, Bell JD. Excess body fat in obese and normal-weight subjects. Nutrition Research Reviews. 2012;25(1):150–161. 🔗 https://pubmed.ncbi.nlm.nih.gov/22625426/
- McLaughlin T, Reaven G, Abbasi F, et al. Is there a simple way to identify insulin-resistant individuals at increased risk of cardiovascular disease? American Journal of Cardiology. 2005;96(3):399–404. 🔗 https://pubmed.ncbi.nlm.nih.gov/16054467/
- Salazar MR, Carbajal HA, Espeche WG, et al. Relation among the plasma triglyceride/high-density lipoprotein cholesterol concentration ratio, insulin resistance, and associated cardio-metabolic risk factors in men and women. American Journal of Cardiology. 2012;109(12):1749–1753. 🔗 https://pubmed.ncbi.nlm.nih.gov/22449634/
- Petersen MC, Shulman GI. Mechanisms of insulin action and insulin resistance. Physiological Reviews. 2018;98(4):2133–2223. 🔗 https://pubmed.ncbi.nlm.nih.gov/30067154/
- Kahn SE. The relative contributions of insulin resistance and beta-cell dysfunction to the pathophysiology of type 2 diabetes. Diabetologia. 2003;46(1):3–19. 🔗 https://pubmed.ncbi.nlm.nih.gov/12637977/
- Weir GC, Bonner-Weir S. Five stages of evolving beta-cell dysfunction during progression to diabetes. Diabetes. 2004;53 Suppl 3:S16–S21. 🔗 https://pubmed.ncbi.nlm.nih.gov/15561905/
- Lambert JE, Ramos-Roman MA, Browning JD, Parks EJ. Increased de novo lipogenesis is a distinct characteristic of individuals with nonalcoholic fatty liver disease. Gastroenterology. 2014;146(3):726–735. 🔗 https://pubmed.ncbi.nlm.nih.gov/24316260/
- Sutton EF, Beyl R, Early KS, Cefalu WT, Ravussin E, Peterson CM. Early time-restricted feeding improves insulin sensitivity, blood pressure, and oxidative stress even without weight loss in men with prediabetes. Cell Metabolism. 2018;27(6):1212–1221. 🔗 https://pubmed.ncbi.nlm.nih.gov/29754952/
- Volek JS, Phinney SD, Forsythe CE, et al. Carbohydrate restriction has a more favorable impact on the metabolic syndrome than a low fat diet. Lipids. 2009;44(4):297–309. 🔗 https://pubmed.ncbi.nlm.nih.gov/19082851/