
HOMA-IR is the most widely cited calculation for assessing insulin resistance in clinical research, and one of the most commonly misinterpreted in clinical practice. The math is simple. The interpretation is not.
The calculation requires two values: fasting insulin and fasting glucose. Both are taken from the same morning blood draw. The formula combines them into a single number that estimates the degree of insulin resistance — specifically, how much insulin the body is producing relative to the glucose level it is managing. A patient producing high insulin to keep glucose normal has high HOMA-IR. A patient producing low insulin and maintaining normal glucose has low HOMA-IR.
In standard clinical practice, the conventional threshold is HOMA-IR below 2.5 as “normal.” Below 2.5 the patient is reassured. Above 2.5 the patient is told they have insulin resistance. This binary framing is one of the most consistent sources of clinical confusion in metabolic medicine — because the threshold is too late to catch the early phase, and the calculation itself fails entirely in late-stage disease.
In my clinical practice in Germany, the patients who actually present at HOMA-IR above 2.5 have typically had insulin resistance operating for years before crossing that threshold. The dysfunction was there. The compensation was working. The calculation said normal. This article explains what HOMA-IR actually measures, what the functional thresholds are, where the calculation fails, and how to read the number against the rest of the clinical picture so it stops being a verdict and starts being a tool.
What you will learn: What HOMA-IR represents biologically — and what it does not | The formula and how to calculate it | Why the conventional threshold of 2.5 catches insulin resistance too late | The functional threshold framework I use in clinical practice | The critical failure mode of HOMA-IR in beta-cell exhaustion | How to integrate HOMA-IR with TG/HDL ratio, glucose trajectory, and liver enzymes for a coherent metabolic picture
Clinical Perspective: What I See in Practice
When a new patient first comes to me in Germany, they almost never have a fasting insulin result on their existing lab panels. The German healthcare system does not routinely test it. The first session is therefore spent reading surrogate markers — TG/HDL ratio, ALT, waist circumference, fasting glucose — to infer what fasting insulin and HOMA-IR would show if they had been measured. This inference is the foundation of the initial clinical assessment.
The patient leaves the consultation with a recommendation to have fasting insulin measured privately, alongside their next standard panel. Four to six weeks later, the comprehensive results arrive. This is the moment HOMA-IR enters the picture.
The first thing I do with the new HOMA-IR value is not interpret it in isolation. I read it against what the surrogate markers predicted. If the TG/HDL ratio was elevated at the first consultation, the HOMA-IR should be elevated now. If the ALT was elevated, the HOMA-IR should reflect a hepatic insulin resistance pattern. The two should agree. When they agree, HOMA-IR is doing its job as a quantifier — it confirms what the rest of the panel already said and gives me a number to track over time.
When they disagree, that is when the clinical question becomes interesting.
The threshold framework I use in practice is different from the textbook. The conventional cutoff of HOMA-IR below 2.5 as “normal” is clinically too late. By the time HOMA-IR crosses 2.5, the patient has typically been insulin resistant for years and the metabolic damage is already established. The functional thresholds I work with run earlier:
Below 1.2 — metabolic health. Insulin and glucose are operating in efficient relationship. No insulin resistance signal.
1.2 to 1.8 — early dysfunction. This is the phase that conventional thresholds miss almost entirely. The patient looks normal on every standard report. The insulin is rising. The glucose is still controlled. The compensation is starting to operate. This is the window where intervention is most reversible and most effective — and where almost nobody is told they have a problem.
1.8 to 2.5 — emerging insulin resistance. Compensation is now substantial. The pancreas is working harder than it should to maintain glucose homeostasis. Most patients in this range have additional surrogate markers that confirm the dysfunction — TG/HDL above 2, waist circumference above functional thresholds, often ALT beginning to drift up.
Above 2.5 — established insulin resistance. This is where the textbook diagnosis is made. By this point the dysfunction has typically been operating for years.
Above 4.0 — advanced insulin resistance. Frequently accompanied by overt metabolic syndrome features and significantly elevated cardiovascular risk through multiple mechanisms.
Empirically, almost every patient who arrives at first consultation with a TG/HDL ratio above 2.0 ends up with a HOMA-IR above 1.8 when fasting insulin is finally measured. The two markers are reading the same underlying physiology from different angles. The TG/HDL ratio captures the hepatic insulin resistance pattern through lipid dynamics. HOMA-IR captures the systemic insulin demand through the insulin-glucose relationship. They typically converge.
When they converge, the clinical picture is straightforward. When they diverge, I trust the other markers and the clinical phenotype more than I trust HOMA-IR alone.
This brings me to the most important limitation of HOMA-IR — the one that is almost never discussed in standard interpretations of the test.
HOMA-IR assumes a functioning pancreas. The calculation makes mechanistic sense only when the beta cells are still able to compensate for insulin resistance by producing more insulin. In that phase — which is most of the disease trajectory — HOMA-IR is reliable. The insulin rises, the calculation rises, the dysfunction is captured.
But in late-stage insulin resistance, the pancreas begins to fail. Beta-cell exhaustion sets in. The pancreas can no longer produce the elevated insulin levels required to maintain glucose control. Glucose climbs. Insulin, paradoxically, falls — because the failing pancreas can no longer match the demand. HOMA-IR, which depends on elevated insulin to register the resistance, falls with it. The calculation looks better as the patient gets worse.
A patient I see this pattern in repeatedly: mid-50s, fasting glucose 148 mg/dL, fasting insulin 6 µU/mL. HOMA-IR calculates to approximately 2.2 — borderline by conventional thresholds, even reassuring on a quick read. The patient or referring clinician might look at this number and conclude that the insulin resistance is mild, that the metabolic dysfunction is contained, that the situation is not urgent.
The rest of the panel tells a completely different story. Triglycerides 190 mg/dL. HDL 38 mg/dL. TG/HDL ratio approximately 5. ALT elevated. Waist circumference well above functional thresholds. This is not borderline metabolic dysfunction. This is advanced insulin resistance with a failing pancreas. The low insulin is not a sign of metabolic health. It is a sign that the beta cells have stopped compensating. The HOMA-IR is falsely reassuring because it is missing the most important variable: the pancreas itself.
When HOMA-IR contradicts the other markers, the other markers are right. HOMA-IR is a compensation marker, not a dysfunction marker. The two are not the same. In the compensatory phase, they overlap. In the late-stage phase, they diverge — and the divergence itself is the clinical signal.
The diagnostic hierarchy I use to keep this clear: TG/HDL ratio flags early, HOMA-IR quantifies the mid-stage, glucose dominates the late-stage picture, and HOMA-IR may falsely normalize at the point when the clinical situation is most serious. This is the framework that lets the calculation be useful without being misleading.
When I explain this to patients — that the same number can mean very different things depending on where they are in the disease trajectory, and that a “borderline” HOMA-IR in their case might actually reflect advanced collapse — the response is consistent. They are surprised. They have been taught, often by clinicians, that the lab values speak for themselves. They do not. The values speak through the clinical context. HOMA-IR is a calculation; the metabolic state is the patient. The two are related but they are not the same thing.
What HOMA-IR Actually Measures
HOMA-IR — Homeostatic Model Assessment of Insulin Resistance — was developed by Matthews and colleagues at Oxford in 1985 as a mathematical estimate of insulin resistance derived from fasting insulin and fasting glucose values. The model was designed to approximate the results of the gold-standard hyperinsulinemic-euglycemic clamp test, which is too complex and expensive for clinical use. HOMA-IR provides a reasonable approximation using two values that can be drawn from a single morning fasting blood sample.
The calculation is straightforward:
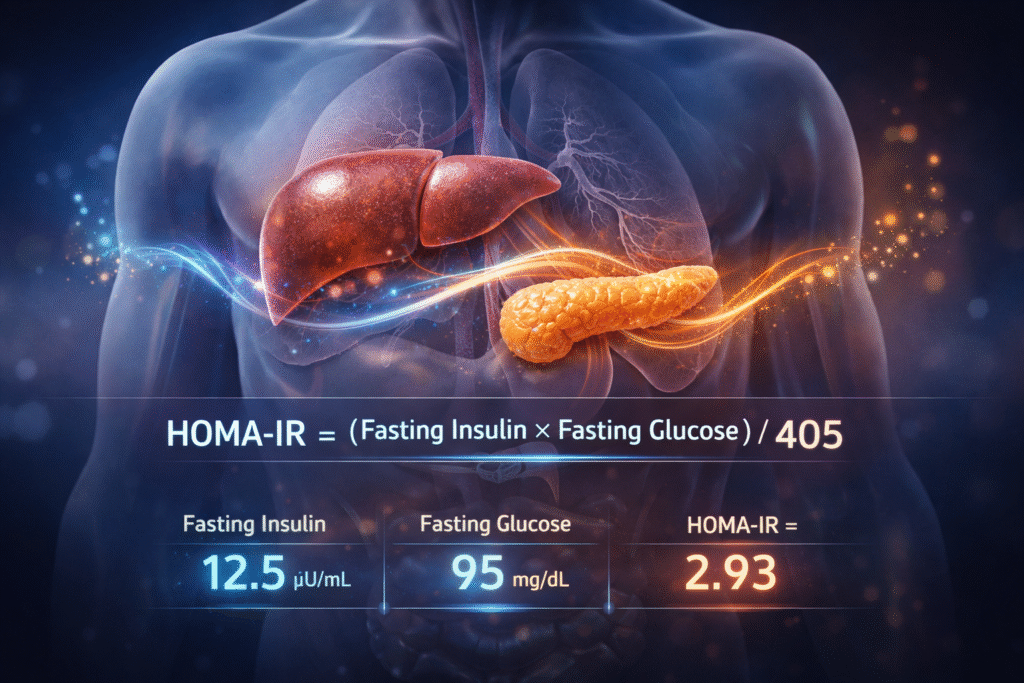
HOMA-IR = (Fasting Insulin in µU/mL × Fasting Glucose in mg/dL) ÷ 405
If glucose is measured in mmol/L instead of mg/dL, the formula becomes:
HOMA-IR = (Fasting Insulin in µU/mL × Fasting Glucose in mmol/L) ÷ 22.5
Both formulas produce the same number when applied to the same values. The choice depends on what units your laboratory reports.
| Fasting Insulin (µU/mL) | Fasting Glucose (mg/dL) | HOMA-IR | Phase |
| 6 | 85 | 1.26 | Metabolic health |
| 7 | 90 | 1.56 | Early dysfunction (frequently missed) |
| 12.5 | 95 | 2.93 | Established insulin resistance |
| 18 | 100 | 4.44 | Advanced insulin resistance |
The number itself is not the point. The relationship between insulin and glucose is. That relationship reflects how hard the body must work at baseline to maintain glucose stability — and that effort is what HOMA-IR attempts to estimate.
The interpretation of the resulting number requires understanding what the calculation actually represents biologically. HOMA-IR is not a direct measurement of insulin resistance at the cellular level. It is a mathematical inference based on a specific assumption: that the relationship between fasting insulin and fasting glucose reflects the body’s effort to maintain glucose homeostasis. The more insulin required to keep glucose at a given level, the more resistant the cells are presumed to be.
This is mechanistically valid in the compensatory phase of insulin resistance. Insulin rises to overcome cellular resistance. Glucose stays in the normal range because the compensation is working. HOMA-IR rises because the formula registers both the elevated insulin and the maintained glucose. The calculation captures what is happening at the systemic level.
The mechanism that makes HOMA-IR meaningful is the same mechanism that produces its central limitation. The formula assumes the pancreas is still producing insulin in response to glucose. When that assumption breaks — when beta-cell exhaustion sets in and insulin output declines despite continued resistance — the formula loses its physiological basis. The calculation continues to produce a number, but the number no longer reflects the underlying state.
This is why HOMA-IR cannot be interpreted in isolation. The calculation has a specific domain of validity, and reading it outside that domain produces clinical errors.
The Functional Threshold Framework
The conventional clinical threshold for HOMA-IR is below 2.5 as “normal” and above 2.5 as indicating insulin resistance. This binary framing is one of the most commonly applied interpretations in primary care, endocrinology, and general medicine. It is also clinically too late.
By the time HOMA-IR crosses 2.5, the patient has typically been operating with rising insulin resistance for years. The metabolic dysfunction that the calculation is meant to detect has already become established. Intervention at this point is still possible — and still effective — but the window for the easiest, most complete reversal has typically passed.
The functional thresholds I use in clinical practice are organized around the actual physiological progression of insulin resistance, not around a single statistical cutoff:
Below 1.2 — Metabolic Health The insulin and glucose values are in efficient relationship. Insulin is low because the cells are responsive. Glucose is well-controlled because insulin signaling is working as intended. This is the state of true metabolic health, not merely the absence of overt disease.
1.2 to 1.8 — Early Dysfunction This is the phase conventional screening misses almost entirely. The fasting insulin is rising — perhaps from an optimal range below 5 µU/mL into the 6 to 10 range. The fasting glucose is still normal because compensation is working. The HOMA-IR sits in this window, below the conventional threshold, while the actual dysfunction is silently progressing. Intervention at this stage is the most reversible and most effective. Almost no patient at this threshold is told they have a problem under conventional care.
1.8 to 2.5 — Emerging Insulin Resistance Compensation is now substantial. Fasting insulin has typically risen above 10 µU/mL. The pancreas is working measurably harder than it should. Other surrogate markers usually confirm the dysfunction at this point — TG/HDL ratio above 2, waist circumference above functional thresholds, often ALT beginning to elevate. This is where the conventional system should be intervening but is typically not.
2.5 to 4.0 — Established Insulin Resistance This is where conventional thresholds finally register the problem. By this point the dysfunction has been operating for years. Metabolic syndrome features are often present. Intervention is still highly effective but is no longer the easy reversal that was possible at lower thresholds.
Above 4.0 — Advanced Insulin Resistance Frequently accompanied by overt metabolic syndrome, dyslipidemia, often pre-diabetes or type 2 diabetes, and substantially elevated cardiovascular risk. The clinical urgency is high and the intervention timeline is correspondingly compressed.
These functional thresholds are not codified in conventional guidelines. They reflect the clinical reality of when metabolic dysfunction is actually detectable and intervenable, not the statistical convenience of a single binary cutoff. Using them shifts the clinical conversation from “do you have insulin resistance” — which is the wrong question at the early phase — to “where are you on the trajectory and what does the rest of the panel say.”
Where HOMA-IR Fails: The Beta-Cell Exhaustion Pattern
The most important clinical limitation of HOMA-IR is the failure mode that occurs in late-stage insulin resistance. Understanding this failure is what separates competent HOMA-IR interpretation from a mechanical application of the formula.
The compensatory phase of insulin resistance — which makes up most of the disease trajectory — is characterized by rising insulin output from a still-functional pancreas. The cells are increasingly resistant. The pancreas produces more insulin to overcome the resistance. Glucose remains in or near the normal range. HOMA-IR rises because both the elevated insulin and the maintained glucose register in the calculation. The formula captures the underlying physiology.
When beta-cell exhaustion sets in — which can occur after years of sustained compensation — the pancreas can no longer produce the elevated insulin levels required. Insulin output begins to decline. Glucose rises because the compensation is failing. The patient becomes overtly hyperglycemic or pre-diabetic. The trajectory has moved from compensation to decompensation.
At this point, HOMA-IR begins to fail as a diagnostic indicator. The calculation depends on elevated insulin to register the resistance. As insulin declines from beta-cell exhaustion, the calculation declines with it — even though the underlying insulin resistance is more severe than ever. The result is a paradox: HOMA-IR can normalize or appear borderline at exactly the point when the patient’s metabolic state is most compromised.
The clinical pattern I see in practice: a mid-50s patient with fasting glucose around 148 mg/dL and fasting insulin around 6 µU/mL. The HOMA-IR calculates to approximately 2.2 — borderline by conventional standards, even reassuring on a quick read. The temptation is to read this as “mild insulin resistance with reasonable insulin output.”
The rest of the panel reveals the actual situation. Triglycerides 190 mg/dL. HDL 38 mg/dL. TG/HDL ratio of approximately 5 — significantly elevated. ALT elevated, suggesting hepatic involvement. Waist circumference well above functional thresholds. Often a family history of type 2 diabetes. Sometimes already overt symptoms of metabolic decline — fatigue, weight gain resistant to dietary change, hypertension.
This is not borderline insulin resistance. This is advanced insulin resistance with a failing pancreas. The low fasting insulin is not a sign of metabolic health. It is a sign of beta-cell exhaustion. The HOMA-IR is falsely reassuring because the formula cannot distinguish between low insulin from metabolic health and low insulin from pancreatic failure. Those two states produce similar HOMA-IR values and represent opposite ends of the metabolic spectrum.
This is why HOMA-IR must be read in clinical context, not in isolation. When the calculation contradicts the broader picture — when HOMA-IR looks borderline but TG/HDL is high, ALT is elevated, waist circumference is significant, and glucose is rising — the broader picture is correct and HOMA-IR is misleading.
The clinical rule that resolves this: HOMA-IR is reliable during the compensatory phases of insulin resistance and unreliable once compensation fails. Knowing which phase the patient is in requires more information than HOMA-IR alone can provide. It requires the full panel and the clinical phenotype.
How to Integrate HOMA-IR With the Rest of the Panel
The diagnostic framework I use places HOMA-IR within a hierarchy of markers, each with a specific role and a specific phase of validity:
Early phase — TG/HDL ratio leads. Before fasting insulin is available, the TG/HDL ratio is the most accessible marker of hepatic insulin resistance. It flags the dysfunction at a stage when HOMA-IR cannot yet be calculated because fasting insulin has not been measured. The TG/HDL ratio is the most useful single number on a standard panel for catching insulin resistance early.
Mid-phase — HOMA-IR quantifies. Once fasting insulin is available and the pancreas is still in compensatory mode, HOMA-IR provides the quantification. It tells you how much insulin demand is operating relative to glucose control. This is the phase where HOMA-IR is most clinically useful and where the functional threshold framework applies directly.
Late phase — glucose dominates and HOMA-IR may mislead. When beta-cell exhaustion sets in, fasting glucose becomes the dominant marker because it captures the failure of compensation directly. HOMA-IR begins to underestimate the severity of the dysfunction because the formula depends on elevated insulin that the pancreas can no longer produce. Reading HOMA-IR in this phase requires careful attention to the rest of the panel.
The full integration involves cross-checking HOMA-IR against:
Fasting insulin alone. Above 10 µU/mL is functional concern regardless of glucose. Above 5 µU/mL combined with other markers of hepatic insulin resistance is clinically meaningful. HOMA-IR cannot replace fasting insulin — it complements it.
TG/HDL ratio. Should generally agree directionally with HOMA-IR in the compensatory phase. Divergence — particularly elevated TG/HDL with apparently normal HOMA-IR — raises suspicion of advanced disease or beta-cell exhaustion.
ALT and GGT. Elevated liver enzymes in the context of HOMA-IR above 1.8 suggest hepatic involvement and often parallel NAFLD. ALT above 35 U/L (functional threshold) is meaningful even when within conventional reference ranges.
Fasting glucose trajectory. A single fasting glucose is a snapshot. The trajectory across multiple panels reveals whether compensation is intact or failing. Rising glucose with stable or falling insulin is the signature of beta-cell exhaustion.
Waist circumference and clinical phenotype. Above 94 cm in men or 80 cm in women indicates visceral adiposity. The clinical picture — body composition, energy patterns, sleep quality, dietary history — provides the context HOMA-IR cannot capture alone.
When all of these markers agree, the clinical picture is straightforward. When HOMA-IR disagrees with the others, the others are typically right. HOMA-IR becomes secondary evidence in this situation, not the primary determinant of diagnosis or intervention.
What Improves HOMA-IR
HOMA-IR improves when the underlying insulin resistance improves. The interventions that produce measurable reductions in HOMA-IR are the same interventions that produce reductions in fasting insulin, TG/HDL ratio, hepatic fat accumulation, and the full metabolic syndrome cascade — because they all share the same upstream driver.
Reduction of dietary refined carbohydrate and fructose load reduces the post-meal insulin demand and gradually restores cellular insulin sensitivity. Triglycerides typically fall first within weeks of significant dietary change. Fasting insulin and HOMA-IR follow as cellular sensitivity recovers, usually within 8 to 16 weeks.
An animal-based, protein-forward eating pattern with adequate dietary fat from whole-food sources supports lean mass, minimizes the insulinogenic load relative to carbohydrate-based patterns, and removes the dietary drivers of hepatic insulin resistance that compound the systemic picture.
Time-restricted eating with extended overnight fasting reduces total insulin exposure across the day. Allowing insulin to remain suppressed for 14 to 16 hours overnight gives the cellular insulin signaling pathways time to recover. HOMA-IR responds to consistent fasting protocols over 8 to 12 weeks in most patients.
Resistance training builds skeletal muscle mass, which is the largest single site of insulin-mediated glucose disposal. Muscle is metabolically protective. Resistance training combined with structured movement reduces visceral adiposity over time and improves the compensatory insulin demand that maintains HOMA-IR elevation.
Sleep optimization and stress management address the cortisol and circadian drivers of hepatic glucose output. Chronic sleep deprivation alone can raise fasting insulin and HOMA-IR independent of diet. No dietary intervention fully compensates for poor sleep.
Elimination of industrial seed oils, high-fructose corn syrup, and ultra-processed foods reduces the gut-liver axis inflammation that compounds insulin resistance through pathways separate from carbohydrate intake. Their elimination produces improvement that pure carbohydrate restriction does not.
These interventions work because they address the upstream cause. HOMA-IR is one of the more responsive markers in metabolic intervention — patients who implement the framework consistently typically see meaningful reductions in HOMA-IR within 8 to 16 weeks, often paralleled by improvements in TG/HDL ratio, fasting glucose, body composition, and subjective energy patterns. The number moves because the physiology moves.
A Note on Uncertainty
HOMA-IR is a mathematical model, not a direct measurement of cellular insulin resistance. The relationship between fasting insulin, fasting glucose, and the underlying physiological state is approximated by the formula but not directly captured. Individual variability, assay differences between laboratories, day-to-day fluctuations in insulin and glucose values, and the limitations described in the beta-cell exhaustion section all affect the interpretation of any single HOMA-IR result.
The specific functional thresholds described in this article — 1.2 as the metabolic health boundary, 1.8 as the emerging dysfunction boundary, 2.5 as the conventional cutoff — reflect the framework I use in clinical practice. They are supported by the broader research literature on insulin resistance progression but are not codified in conventional clinical guidelines, which continue to use the binary threshold of 2.5 as their primary cutoff.
The choice of which framework to apply depends on the clinical question being asked. For early detection of insulin resistance before glucose dysregulation has occurred, the functional thresholds are substantially more useful. For documentation in the context of conventional clinical care, the standard thresholds apply.
A single HOMA-IR value is also less informative than the trajectory across multiple panels. The direction of change over time — improving, stable, or worsening — is often more clinically meaningful than the absolute value at a single time point.
Practical Implications
If you have a recent fasting insulin and fasting glucose result, you can calculate your own HOMA-IR. The formula is HOMA-IR = (Fasting Insulin in µU/mL × Fasting Glucose in mg/dL) ÷ 405. If glucose is in mmol/L, divide by 22.5 instead. The calculation takes seconds.
If your HOMA-IR is below 1.2 and your other markers are consistent with metabolic health, you have meaningful confirmation that insulin signaling is operating well. If your HOMA-IR is between 1.2 and 1.8, you are in the early dysfunction window that conventional screening typically misses — and this is the most reversible phase of the trajectory. If your HOMA-IR is above 1.8, established insulin resistance is operating regardless of whether conventional thresholds have been crossed.
If your HOMA-IR appears low or borderline but your TG/HDL ratio is elevated, your ALT is elevated, your waist circumference is above functional thresholds, or your fasting glucose is climbing, the broader picture is more reliable than the calculation. HOMA-IR may be underestimating the severity of the dysfunction, particularly if you are in the age range and clinical context where beta-cell exhaustion becomes relevant.
The most useful next steps depend on where you are on the trajectory. Early HOMA-IR elevation responds to the dietary, fasting, and movement-based interventions described above. Advanced HOMA-IR or HOMA-IR with beta-cell exhaustion features requires a more structured intervention with closer monitoring of glucose trajectory alongside the lifestyle interventions.
HOMA-IR is a useful calculation when read with clinical judgment. It is not a diagnosis. The diagnosis lives in the integration of HOMA-IR with the rest of the panel and the clinical phenotype — and in knowing which phase of the disease trajectory the calculation is reading from.
| Fasting Insulin (µU/mL) | Fasting Glucose (mg/dL) | HOMA-IR | Phase |
| 6 | 85 | 1.26 | Metabolic health |
| 7 | 90 | 1.56 | Early dysfunction (frequently missed) |
| 12.5 | 95 | 2.93 | Established insulin resistance |
| 18 | 100 | 4.44 | Advanced insulin resistance |
The number itself is not the point. The relationship between insulin and glucose is. That relationship reflects how hard the body must work at baseline to maintain glucose stability — and that effort is what HOMA-IR attempts to estimate.
People Also Ask
What is HOMA-IR?
HOMA-IR — Homeostatic Model Assessment of Insulin Resistance — is a calculation derived from fasting insulin and fasting glucose values that estimates the degree of insulin resistance. The formula is HOMA-IR = (Fasting Insulin × Fasting Glucose) ÷ 405 when glucose is in mg/dL, or ÷ 22.5 when glucose is in mmol/L. It was developed in 1985 as a simpler alternative to the hyperinsulinemic-euglycemic clamp test.
What is a normal HOMA-IR?
Conventional clinical guidelines use HOMA-IR below 2.5 as the threshold for normal. In functional metabolic practice, the more clinically useful thresholds are: below 1.2 reflects metabolic health, 1.2 to 1.8 indicates early dysfunction that conventional screening typically misses, 1.8 to 2.5 indicates emerging insulin resistance, above 2.5 confirms established insulin resistance, and above 4.0 reflects advanced disease.
How do I calculate my HOMA-IR?
If your fasting glucose is reported in mg/dL: HOMA-IR = (Fasting Insulin in µU/mL × Fasting Glucose in mg/dL) ÷ 405. If your fasting glucose is in mmol/L: HOMA-IR = (Fasting Insulin in µU/mL × Fasting Glucose in mmol/L) ÷ 22.5. Both formulas produce the same number. Both fasting insulin and fasting glucose must be drawn after a 10 to 12 hour fast.
Can HOMA-IR be falsely low?
Yes — and this is one of the most important limitations of the calculation. In late-stage insulin resistance with beta-cell exhaustion, the pancreas can no longer produce the elevated insulin levels required to maintain compensation. Insulin falls, glucose rises, and HOMA-IR may normalize or appear borderline at exactly the point when the underlying disease is most severe. When HOMA-IR contradicts other markers of insulin resistance — elevated TG/HDL ratio, elevated ALT, rising fasting glucose — the other markers are typically right and HOMA-IR is misleading.
Is HOMA-IR better than fasting insulin alone?
HOMA-IR and fasting insulin measure different aspects of the same underlying physiology. Fasting insulin reflects pancreatic insulin output. HOMA-IR reflects the relationship between insulin output and glucose control. Both have clinical value. In the compensatory phase of insulin resistance they generally agree directionally, but HOMA-IR can capture early dysfunction when fasting insulin alone is in a borderline range. In late-stage disease with beta-cell exhaustion, fasting insulin alone may be misleadingly low and HOMA-IR shares that limitation.
Can HOMA-IR detect insulin resistance before diabetes?
Yes — and this is its primary clinical value. HOMA-IR can be elevated for years before fasting glucose, HbA1c, or postprandial glucose dysregulation becomes apparent. The early functional thresholds described in this article capture insulin resistance in the compensatory phase, when intervention is most reversible. By the time conventional glucose-based screening detects the dysfunction, the metabolic damage has typically been operating for a decade or more.
How quickly does HOMA-IR change with intervention?
HOMA-IR responds to dietary, fasting, exercise, and sleep interventions over 8 to 16 weeks in most patients. The marker tracks the underlying physiology — when insulin resistance improves, HOMA-IR falls. Patients implementing comprehensive lifestyle interventions typically see meaningful reductions paralleling improvements in TG/HDL ratio, body composition, and energy patterns. The number moves because the metabolic state moves.
About the Author
Morteza Ariana is a State-Certified Functional Nutritionist based in Germany, specializing in insulin resistance, type 2 diabetes, and root-cause metabolic restoration. He holds advanced training in systems-based physiology and has worked with patients across the U.S. and Europe for over 10 years.
His clinical framework is built around a core principle that mainstream medicine consistently overlooks: chronically elevated insulin — not blood glucose — is the earliest and most actionable driver of metabolic disease. That conviction was shaped in part by his own experience with hyperinsulinemia in 2016, and deepened through a decade of clinical practice and the study of leading researchers in metabolic medicine including Benjamin Bikman, Joseph Kraft, Gerald Reaven, Jason Fung, and Stephen Phinney.
His work focuses on identifying and correcting the upstream metabolic signals — insulin load, liver-gut axis dysfunction, circadian misalignment, and micronutrient gaps — that standard screening misses entirely. Patient outcomes are documented, anonymized, and published on this site.
If this resonates, the next step is clarity
The Metabolic Restoration Blueprint is a structured 12-week framework designed to correct upstream metabolic drivers — not just manage symptoms.
Scientific References
- Matthews DR, Hosker JP, Rudenski AS, Naylor BA, Treacher DF, Turner RC. Homeostasis model assessment: insulin resistance and beta-cell function from fasting plasma glucose and insulin concentrations in man. Diabetologia. 1985;28(7):412–419. 🔗 https://pubmed.ncbi.nlm.nih.gov/3899825/
- Wallace TM, Levy JC, Matthews DR. Use and abuse of HOMA modeling. Diabetes Care. 2004;27(6):1487–1495. 🔗 https://pubmed.ncbi.nlm.nih.gov/15161807/
- Tang Q, Li X, Song P, Xu L. Optimal cut-off values for the homeostasis model assessment of insulin resistance (HOMA-IR) and pre-diabetes screening: developments in research and prospects for the future. Drug Discoveries & Therapeutics. 2015;9(6):380–385. 🔗 https://pubmed.ncbi.nlm.nih.gov/26781921/
- Reaven GM. Role of insulin resistance in human disease. Diabetes. 1988;37(12):1595–1607. 🔗 https://pubmed.ncbi.nlm.nih.gov/3056758/
- Petersen MC, Shulman GI. Mechanisms of insulin action and insulin resistance. Physiological Reviews. 2018;98(4):2133–2223. 🔗 https://pubmed.ncbi.nlm.nih.gov/30067154/
- Kahn SE. The relative contributions of insulin resistance and beta-cell dysfunction to the pathophysiology of type 2 diabetes. Diabetologia. 2003;46(1):3–19. 🔗 https://pubmed.ncbi.nlm.nih.gov/12637977/
- Tabák AG, Jokela M, Akbaraly TN, Brunner EJ, Kivimäki M, Witte DR. Trajectories of glycaemia, insulin sensitivity, and insulin secretion before diagnosis of type 2 diabetes: an analysis from the Whitehall II study. The Lancet. 2009;373(9682):2215–2221. 🔗 https://pubmed.ncbi.nlm.nih.gov/19515410/
- Weir GC, Bonner-Weir S. Five stages of evolving beta-cell dysfunction during progression to diabetes. Diabetes. 2004;53 Suppl 3:S16–S21. 🔗 https://pubmed.ncbi.nlm.nih.gov/15561905/
- McLaughlin T, Reaven G, Abbasi F, et al. Is there a simple way to identify insulin-resistant individuals at increased risk of cardiovascular disease? American Journal of Cardiology. 2005;96(3):399–404. 🔗 https://pubmed.ncbi.nlm.nih.gov/16054467/
- Salgado AL, Carvalho L, Oliveira AC, Santos VN, Vieira JG, Parise ER. Insulin resistance index (HOMA-IR) in the differentiation of patients with non-alcoholic fatty liver disease and healthy individuals. Arquivos de Gastroenterologia. 2010;47(2):165–169. 🔗 https://pubmed.ncbi.nlm.nih.gov/20721461/
- Gastaldelli A. Measuring and estimating insulin resistance in clinical and research settings. Obesity. 2022;30(8):1549–1563. 🔗 https://pubmed.ncbi.nlm.nih.gov/35894085/
- Hyde PN, Sapper TN, Crabtree CD, et al. Dietary carbohydrate restriction improves metabolic syndrome independent of weight loss. JCI Insight. 2019;4(12):e128308. 🔗 https://pubmed.ncbi.nlm.nih.gov/31217353/
- Sutton EF, Beyl R, Early KS, Cefalu WT, Ravussin E, Peterson CM. Early time-restricted feeding improves insulin sensitivity, blood pressure, and oxidative stress even without weight loss in men with prediabetes. Cell Metabolism. 2018;27(6):1212–1221. 🔗 https://pubmed.ncbi.nlm.nih.gov/29754952/
- Eckel RH, Grundy SM, Zimmet PZ. The metabolic syndrome. The Lancet. 2005;365(9468):1415–1428. 🔗 https://pubmed.ncbi.nlm.nih.gov/15836891/