
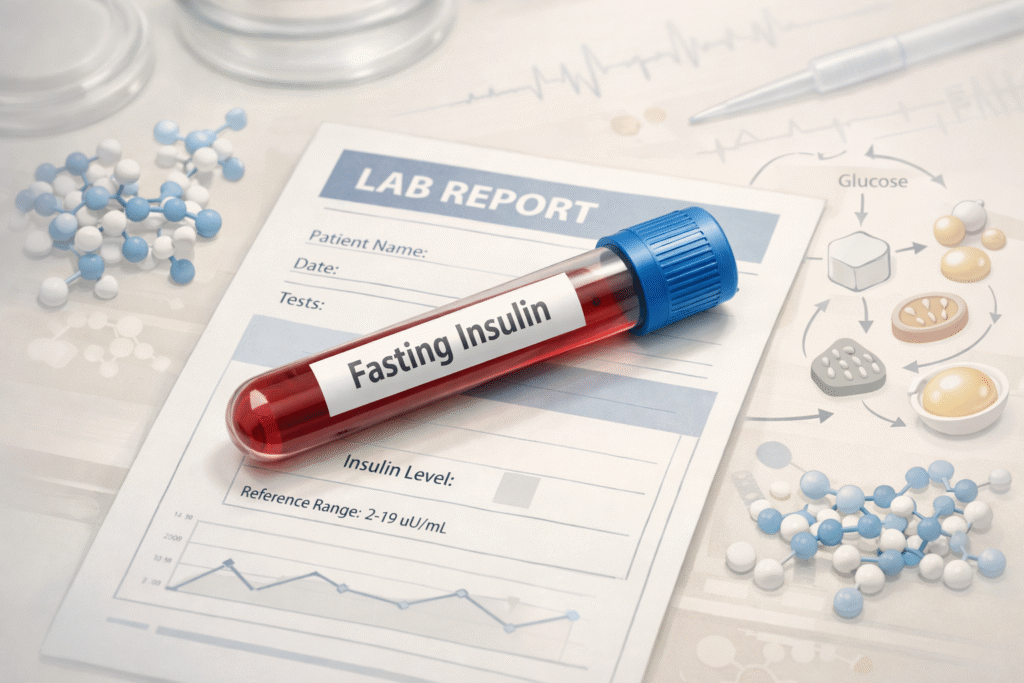
Fasting insulin optimal range is one of the most important concepts in early metabolic assessment. A value can fall inside the lab reference range and still suggest emerging insulin resistance or metabolic dysfunction.
Most standard blood panels flag fasting insulin as normal if it falls below 25 µIU/mL. But for anyone serious about long-term metabolic health, that number is almost meaningless. By the time fasting insulin reaches 25, insulin resistance is already well established — often for years.
The real question is not whether your fasting insulin is within the laboratory reference range. The question is where it sits relative to optimal metabolic function. The distinction matters because insulin resistance develops gradually, silently, and decades before it shows up as pre-diabetes or type 2 diabetes on a standard screen.
This article explains what fasting insulin actually measures, why the conventional reference range is too permissive, what the evidence suggests as an optimal target, and how to interpret your result in the context of your broader metabolic picture.
What you will learn: What fasting insulin measures and why it matters | The difference between a ‘normal’ lab result and an optimal result | Clinically meaningful thresholds supported by research | How fasting insulin compares to HbA1c and HOMA-IR | What elevated fasting insulin tells you about cardiovascular and metabolic risk
What Is Fasting Insulin — and What Does It Actually Measure?
Insulin is the hormone produced by the beta cells of the pancreas in response to rising blood glucose. Its primary job is to signal cells — particularly in muscle, liver, and fat tissue — to take up glucose from the bloodstream. In a metabolically healthy individual, a small amount of insulin is sufficient to maintain stable blood glucose.
Fasting insulin is measured after a minimum of 8 hours without food. In this fasted state, blood glucose is at its baseline and insulin should be low. The amount of insulin required to maintain that baseline is a direct proxy for how sensitive your cells are to insulin’s signal.
This is the central principle: the higher the fasting insulin, the more insulin is needed to do the same job. That is the definition of insulin resistance.
The Physiology of Insulin Resistance
Insulin resistance develops when cells downregulate their insulin receptors or impair the downstream signalling cascade — typically in response to chronic overexposure to insulin itself, excess intracellular fat, inflammation, or sedentary behaviour.
As cells become less responsive, the pancreas compensates by secreting more insulin to achieve the same glucose-lowering effect. Blood glucose may remain ‘normal’ for years — or even decades — while insulin quietly climbs. This is called compensatory hyperinsulinemia, and it is the earliest detectable metabolic abnormality in most people who eventually develop type 2 diabetes or cardiovascular disease.
Standard glucose tests — fasting glucose, HbA1c, even an oral glucose tolerance test — often miss this window entirely. By the time blood glucose becomes abnormal, beta cell function is already compromised. Fasting insulin catches the problem earlier.
The Problem with Standard Laboratory Fasting Insulin Optimal Range
Most laboratories in Europe and the United States report fasting insulin as normal anywhere below 17–25 µIU/mL, depending on the assay. Some labs use an upper limit as high as 29 µIU/mL.
These ranges are derived from population averages — not from studies of optimal metabolic health. In populations where insulin resistance is common (which describes the majority of Western adults), the average is inherently elevated. Using a diseased population to define ‘normal’ sets the bar far too low.
Research by Kraft (1975) and later confirmed by multiple metabolic studies demonstrates that insulin resistance frequently exists in individuals with fasting insulin values between 8 and 12 µIU/mL — values that would pass as entirely unremarkable on any standard lab report.
Clinical Perspective: What I See in Practice
The moment that most consistently produces clinical recognition in my practice is not the moment a patient receives their fasting insulin result. It is the when they understand what the lab reference range next to that result actually means.
A patient comes in with a fasting insulin of 12 µU/mL. The lab report lists the reference range as 2.6 to 24.9 µU/mL. There is a green checkmark next to the value. The conclusion the patient draws — and the conclusion their GP has typically reinforced — is straightforward: “I am fine.” This is the point where the most important pedagogical opportunity in the entire consultation opens, because the laboratory reference range does not define optimal physiology. It reflects what is statistically common in the tested population. Given the current prevalence of metabolic dysfunction, a significant percentage of that population is itself metabolically unwell. The reference range, in effect, normalizes the dysfunction.
The reframing that follows changes everything about the subsequent clinical conversation. I usually use an analogy: if two individuals both present with a fasting glucose of 90 mg/dL, yet one requires an insulin level of 3 µU/mL to maintain it while the other needs 15 µU/mL, these are not metabolically equivalent human beings. This is the moment the patient grasps the distinction between statistical normality and biological efficiency.
Functionally, this distinction is paramount. A fasting insulin of 12 µU/mL may prevent overt hyperglycemia for years. It frequently reflects a system already under significant compensatory strain beneath the surface — the same compensatory phase of insulin resistance that conventional glucose-based screening systematically misses.
The framework I use in practice runs through four functional tiers, each tied to what is happening physiologically.
Below 5 µU/mL is metabolically excellent — the system is operating efficiently and insulin demand is appropriate to glucose load.
Between 5 and 8 µU/mL is acceptable but warrants careful contextualization, particularly against the TG/HDL ratio, liver enzymes, and clinical phenotype.
Between 8 and 10 µU/mL is the emerging compensatory phase — insulin is rising measurably, the pancreas is working harder than it should, and intervention at this stage produces the most complete and most easily reversible response.
Between 12 and 15 µU/mL signals significant hyperinsulinemia unless proven otherwise — established compensation is operating, and the TG/HDL ratio, ALT, GGT, and waist circumference almost always confirm the metabolic picture.
Context always matters. Athletic status versus sedentary lifestyle, adaptation to a low-carbohydrate diet, acute stress, sleep deprivation, liver status, and the rest of the clinical picture all influence interpretation of any single value. But the broader principle holds: conventional normal ranges identify the absence of an acute crisis, not the presence of optimal metabolic health. Those are two completely different clinical questions.
I have repeatedly encountered patients whose fasting insulin sat in the conventional normal 10 to 15 µU/mL range yet whose clinical picture told a clear story of dysfunction — elevated TG/HDL ratio, patterns indicative of fatty liver, central adiposity, a rising hs-CRP signaling chronic low-grade inflammation, postprandial fatigue, and increasing waist size despite stable body weight.
One anonymized case from my practice illustrates the pattern.
A lean middle-aged man arrived with fasting insulin at 13 µU/mL, fasting glucose at 96 mg/dL, and HbA1c at 5.4%. His physician had reassured him completely. The lab report flagged nothing. But his TG/HDL ratio was above 3, his ALT was mildly elevated, his waist circumference was progressively increasing despite stable body weight, and he reported severe afternoon energy crashes. The conventional reading produced no intervention. Two years later, without any change in his management, both his fasting glucose and his HbA1c had significantly worsened.
When the patient finally understood what his fasting insulin had been telling him during those two years, the intervention itself was surprisingly moderate: removal of ultra-processed foods, sleep hygiene improvements, resistance training, reduction in meal frequency, and improvement in protein quality. Within months his fasting insulin dropped substantially, his TG/HDL ratio improved, his liver enzymes normalized — and all of this occurred well before any significant weight loss.
This is what fasting insulin offers when interpreted correctly: a window into metabolic strain during the compensatory phase, when reversal is still highly achievable. The lab reference range gives you statistical company. The functional optimal range gives you biological efficiency. They are not the same thing, and the difference between them is often the difference between catching dysfunction at 45 and managing diabetes at 60.
The clinical conversation that produces this recognition is, in my experience, the single most consequential moment in a metabolic consultation. Everything that follows — the dietary intervention, the lifestyle restructuring, the patient’s psychological orientation toward their own biology — runs through whether that moment has occurred.
Clinical point
A fasting insulin result of 12 µIU/mL will be reported as ‘normal’ on virtually every standard lab panel. But in the context of optimal metabolic health, a value of 12 already indicates meaningful insulin resistance — particularly in a lean individual with no other apparent risk factors.
What the Evidence Says: Optimal Fasting Insulin Ranges
Across the published literature on insulin resistance, cardiovascular risk, and metabolic health, a consistent picture emerges. The following framework reflects clinically actionable thresholds based on current evidence:
| Category | Fasting Insulin (µIU/mL) | Clinical Significance |
| Optimal (metabolic health) | < 5 | Excellent insulin sensitivity, low metabolic risk |
| Acceptable | 5–10 | Reasonable range but warrants monitoring |
| Borderline elevated | 10–15 | Early insulin resistance; lifestyle intervention indicated |
| Insulin resistance | 15–25 | Significant IR; address root causes urgently |
| Severe / overt IR | > 25 | High risk of T2D, cardiovascular disease, NAFLD |
Several key findings support this stratification:
- A large analysis published in the European Journal of Endocrinology (2021) found that individuals with fasting insulin above 9 µIU/mL had significantly elevated risk of incident type 2 diabetes compared to those below 6 µIU/mL, independent of fasting glucose or BMI.
- Data from the San Antonio Heart Study and other longitudinal cohorts demonstrate that fasting insulin in the range of 10–15 µIU/mL predicts progression to metabolic syndrome years before glucose becomes abnormal.
- Athletic and metabolically healthy populations routinely show fasting insulin values of 3–6 µIU/mL, suggesting this represents true physiological normal — not merely the absence of overt disease.
How Fasting Insulin Compares to HbA1c and HOMA-IR
Fasting Insulin vs. HbA1c
HbA1c reflects average blood glucose over the previous 8–12 weeks. It is an excellent marker for diagnosing and monitoring established diabetes. However, it is a late-stage marker. Glucose rises only after compensatory insulin secretion begins to fail.
Fasting insulin detects the compensatory phase — when the pancreas is working harder but glucose is still being maintained. This makes fasting insulin a significantly earlier warning signal than HbA1c for the trajectory of insulin resistance.
In practice: a patient can have a normal HbA1c of 5.3% with a fasting insulin of 18 µIU/mL. The HbA1c provides false reassurance. The insulin tells you insulin resistance is present and progressing.
HOMA-IR: Adding Fasting Glucose to the Picture
HOMA-IR (Homeostatic Model Assessment of Insulin Resistance) combines fasting insulin and fasting glucose into a single index using the formula:
HOMA-IR = (Fasting Insulin [µIU/mL] × Fasting Glucose [mmol/L]) ÷ 22.5
A HOMA-IR below 1.0 is generally considered optimal. Values above 2.0 indicate significant insulin resistance; above 2.9 is associated with substantially elevated cardiovascular and metabolic risk.
HOMA-IR is useful because it accounts for fasting glucose, providing a more complete picture. However, in early insulin resistance where glucose is still normal, fasting insulin alone may be equally informative and simpler to interpret.
Why Elevated Fasting Insulin Matters Beyond Blood Sugar
Insulin is not only a glucose-regulating hormone. It has pervasive effects across multiple organ systems, and chronic hyperinsulinemia drives pathology far beyond glucose metabolism.
Cardiovascular Risk
Chronic hyperinsulinemia is an independent predictor of coronary artery disease, atherosclerosis, and all-cause cardiovascular mortality — effects that are partially mediated through its promotion of dyslipidemia (elevated triglycerides, suppressed HDL).
Body Composition and Fat Storage
Insulin is an anabolic hormone that inhibits lipolysis — the breakdown of stored fat. Chronically elevated insulin makes it significantly harder to mobilize fat stores for energy, even in a caloric deficit. This is why some individuals with elevated fasting insulin struggle disproportionately with fat loss despite controlling caloric intake.
Hormonal Disruption
In women, hyperinsulinemia drives ovarian androgen production, a key mechanism in polycystic ovary syndrome (PCOS). In men, elevated insulin is associated with lower testosterone and impaired sex hormone binding globulin (SHBG). These downstream hormonal effects underscore that fasting insulin is not merely a metabolic marker — it reflects the health of the entire endocrine environment.
Cognitive and Neurological Health
Emerging research increasingly refers to Alzheimer’s disease as a condition of impaired cerebral insulin signaling. The brain is an insulin-sensitive organ. Chronic systemic hyperinsulinemia, followed by progressive insulin resistance, may impair neuronal glucose uptake and accelerate neurodegenerative processes. While causality remains an active area of research, the association between insulin resistance and cognitive decline is now well established.
What Drives Fasting Insulin Up? Root Causes to Address
Elevated fasting insulin is not a disease in itself — it is a signal. Understanding the drivers allows for targeted intervention.
- Excess dietary refined carbohydrate and sugar: The most direct driver. High-frequency insulin secretion from a high-glycemic diet progressively reduces insulin sensitivity.
- Sedentary behavior: Muscle is the primary site of insulin-mediated glucose disposal. Low muscle mass and physical inactivity substantially increase insulin requirements.
- Visceral adiposity: Excess intra-abdominal fat releases free fatty acids and pro-inflammatory cytokines that directly impair insulin receptor signaling in liver and muscle.
- Sleep disruption: Even a single night of poor sleep can measurably increase insulin resistance. Chronic sleep deprivation is an underappreciated metabolic stressor.
- Chronic stress: Cortisol is counter-regulatory to insulin. Sustained cortisol elevation drives gluconeogenesis and reduces insulin sensitivity in peripheral tissue.
- Ultra-processed food exposure: Independent of macronutrient content, ultra-processed foods promote inflammation and gut dysbiosis — both of which contribute to insulin resistance.
How to Test and Interpret Fasting Insulin: Practical Guidance
Testing Conditions
Fasting insulin must be measured after a minimum 8-hour fast, ideally 10–12 hours. Any caloric intake — including milk in coffee — will stimulate insulin secretion and invalidate the result. Water is fine. The test should be conducted in the morning before any significant physical exertion.
Interpreting Your Result
The number alone is insufficient. Fasting insulin should be interpreted alongside:
- Fasting glucose: To calculate HOMA-IR and contextualize insulin requirement
- HbA1c: To identify whether glucose dysregulation has already begun
- Triglycerides and HDL: The triglyceride-to-HDL ratio is a strong independent predictor of insulin resistance
- Waist circumference and body composition: Visceral fat is both a cause and a consequence of insulin resistance
- Clinical history: Family history of T2D, PCOS, NAFLD, or cardiovascular disease all raise the relevance of any given insulin value
A Note on Assay Variability
Fasting insulin values can vary between laboratories depending on the immunoassay used. Different essays have different cross-reactivity with proinsulin and different reference standards. This means that comparing absolute values across different laboratories requires caution. Serial measurements within the same laboratory over time are more clinically meaningful than a single reading or cross-laboratory comparisons.
Lifestyle Interventions That Reduce Fasting Insulin
The evidence for lifestyle intervention in reducing fasting insulin is robust and clinically significant.
Dietary Approaches
Reducing dietary carbohydrate load — particularly refined carbohydrates and sugar — consistently lowers fasting insulin. Low-carbohydrate and ketogenic dietary patterns show the strongest and most rapid effects. Time-restricted eating and intermittent fasting reduce insulin through extended fasting windows. Substituting ultra-processed foods with whole food sources, irrespective of macronutrient composition, also lowers inflammatory drivers of insulin resistance.
Exercise
Resistance training improves insulin sensitivity by expanding the capacity of skeletal muscle to take up glucose independently of insulin. High-intensity interval training (HIIT) has demonstrated significant reductions in fasting insulin in multiple randomised controlled trials. Even a single session of moderate aerobic exercise transiently improves insulin sensitivity for 24–48 hours — an effect that accumulates with consistent training.
Sleep and Stress Management
Optimizing sleep quality and duration (targeting 7–9 hours in most adults) and implementing evidence-based stress management practices (cognitive behavioral approaches, structured relaxation) address two underrecognized drivers of elevated fasting insulin.
A Note on Uncertainty
The optimal range for fasting insulin is not defined by a single definitive clinical trial — it is inferred from large epidemiological studies, mechanistic research, and clinical observation. Different experts draw slightly different lines, and individual variability is real.
What the evidence does consistently show is that lower fasting insulin — within a physiological range — is associated with better long-term metabolic and cardiovascular outcomes. A fasting insulin below 5 µIU/mL in a lean, active individual is not a cause for concern. The same value in an individual with visceral adiposity, poor diet, and sedentary behavior may indicate genuine insulin suppression via chronic under-eating, rather than insulin sensitivity.
Context always matters. Fasting insulin is a tool for clinical reasoning — not a standalone verdict.
Next Steps
If you have not yet measured your fasting insulin — request it at your next blood draw. It is inexpensive, widely available, and provides information that standard glucose tests routinely miss.
If you have a result and want to understand what it means in the context of your full metabolic profile, the next step is a structured metabolic assessment that integrates fasting insulin with glucose, HbA1c, lipids, body composition, and clinical history.
The question is not whether your insulin is ‘normal’. The question is whether it is optimal — and what it is telling you about your long-term trajectory.
People Also Ask
What is the optimal fasting insulin level?
Research and clinical evidence support a fasting insulin below 5 µIU/mL as optimal. This reflects strong insulin sensitivity and low metabolic risk. Values between 5–10 µIU/mL are acceptable but warrant monitoring, while anything above 10 µIU/mL indicates early insulin resistance.
What does a high fasting insulin level mean?
A fasting insulin above 10–15 µIU/mL indicates that your pancreas is secreting excess insulin to compensate for reduced cellular sensitivity — the hallmark of insulin resistance. This raises long-term risk of type 2 diabetes, cardiovascular disease, and hormonal disruption, even when fasting glucose and HbA1c still appear normal.
Is fasting insulin better than HbA1c for detecting insulin resistance?
In most cases, yes. Fasting insulin detects compensatory hyperinsulinemia years before blood glucose becomes abnormal. HbA1c only rises once beta cell function begins to fail — a much later stage of the process. If you only test HbA1c, you may receive false reassurance.
What is a normal fasting insulin level on a standard lab report?
Most laboratories report fasting insulin as normal below 17–25 µIU/mL. However, these ranges are based on population averages in populations where insulin resistance is common — not on studies of optimal metabolic health. A result that passes as “normal” on a lab report may still indicate meaningful insulin resistance from a clinical perspective.
How can I lower my fasting insulin naturally?
The most effective evidence-based strategies are: reducing refined carbohydrates and sugar, increasing resistance training and aerobic exercise, improving sleep quality (targeting 7–9 hours), managing chronic stress, and eliminating ultra-processed foods. These address the root drivers of insulin resistance rather than the symptom.
About the Author
Morteza Ariana is a State-Certified Functional Nutritionist based in Germany, specializing in insulin resistance, type 2 diabetes, and root-cause metabolic restoration. He holds advanced training in systems-based physiology and has worked with patients across the U.S. and Europe for over 10 years.
His clinical framework is built around a core principle that mainstream medicine consistently overlooks: chronically elevated insulin — not blood glucose — is the earliest and most actionable driver of metabolic disease. That conviction was shaped in part by his own experience with hyperinsulinemia in 2016, and deepened through a decade of clinical practice and the study of leading researchers in metabolic medicine including Benjamin Bikman, Joseph Kraft, Gerald Reaven, Jason Fung, and Stephen Phinney.
His work focuses on identifying and correcting the upstream metabolic signals — insulin load, liver-gut axis dysfunction, circadian misalignment, and micronutrient gaps — that standard screening misses entirely. Patient outcomes are documented, anonymized, and published on this site.
If this resonates, the next step is clarity
The Metabolic Restoration Blueprint is a structured 12-week framework designed to correct upstream metabolic drivers — not just manage symptoms.
Key References
1. Kraft JR. Detection of diabetes mellitus in situ (occult diabetes). Laboratory Medicine. 1975;6(2):10–22.
2. Sung KC, et al. Combined influence of insulin resistance, overweight/obesity, and fatty liver as risk factors for type 2 diabetes. Diabetes Care. 2012;35(4):717–722.
3. Reaven GM. Role of insulin resistance in human disease. Diabetes. 1988;37(12):1595–1607.
4. Facchini FS, et al. Insulin resistance as a predictor of age-related diseases. Journal of Clinical Endocrinology & Metabolism. 2001;86(8):3574–3578.
5. Abdul-Ghani MA, Defronzo RA. Pathogenesis of insulin resistance in skeletal muscle. Journal of Biomedicine and Biotechnology. 2010;2010:476279.
6. Crofts CAP, Schofield G, Zinn C, Wheldon M, Kraft J. Identifying hyperinsulinaemia in the absence of impaired glucose tolerance: an examination of the Kraft database. Diabetes Research and Clinical Practice. 2016;118:50–57. 🔗 https://pubmed.ncbi.nlm.nih.gov/27344544/
7. Weyer C, Hanson RL, Tataranni PA, Bogardus C, Pratley RE. A high fasting plasma insulin concentration predicts type 2 diabetes independent of insulin resistance: evidence for a pathogenic role of relative hyperinsulinemia. Diabetes. 2000;49(12):2094–2101. 🔗 https://pubmed.ncbi.nlm.nih.gov/11118012/
8. Despres JP, Lamarche B, Mauriège P, et al. Hyperinsulinemia as an independent risk factor for ischemic heart disease. New England Journal of Medicine. 1996;334(15):952–957. 🔗 https://pubmed.ncbi.nlm.nih.gov/8596596/
9. Tabák AG, Jokela M, Akbaraly TN, Brunner EJ, Kivimäki M, Witte DR. Trajectories of glycaemia, insulin sensitivity, and insulin secretion before diagnosis of type 2 diabetes: an analysis from the Whitehall II study. The Lancet. 2009;373(9682):2215–2221. 🔗 https://pubmed.ncbi.nlm.nih.gov/19515410/
10. Matthews DR, Hosker JP, Rudenski AS, Naylor BA, Treacher DF, Turner RC. Homeostasis model assessment: insulin resistance and beta-cell function from fasting plasma glucose and insulin concentrations in man. Diabetologia. 1985;28(7):412–419. 🔗 https://pubmed.ncbi.nlm.nih.gov/3899825/
11. Petersen MC, Shulman GI. Mechanisms of insulin action and insulin resistance. Physiological Reviews. 2018;98(4):2133–2223. 🔗 https://pubmed.ncbi.nlm.nih.gov/30067154/
12. Kahn SE. The relative contributions of insulin resistance and beta-cell dysfunction to the pathophysiology of type 2 diabetes. Diabetologia. 2003;46(1):3–19. 🔗 https://pubmed.ncbi.nlm.nih.gov/12637977/
13. de la Monte SM, Wands JR. Alzheimer’s disease is type 3 diabetes — evidence reviewed. Journal of Diabetes Science and Technology. 2008;2(6):1101–1113. 🔗 https://pmc.ncbi.nlm.nih.gov/articles/PMC4444430/
14. Sutton EF, Beyl R, Early KS, Cefalu WT, Ravussin E, Peterson CM. Early time-restricted feeding improves insulin sensitivity, blood pressure, and oxidative stress even without weight loss in men with prediabetes. Cell Metabolism. 2018;27(6):1212–1221. 🔗 https://pubmed.ncbi.nlm.nih.gov/29754952/