
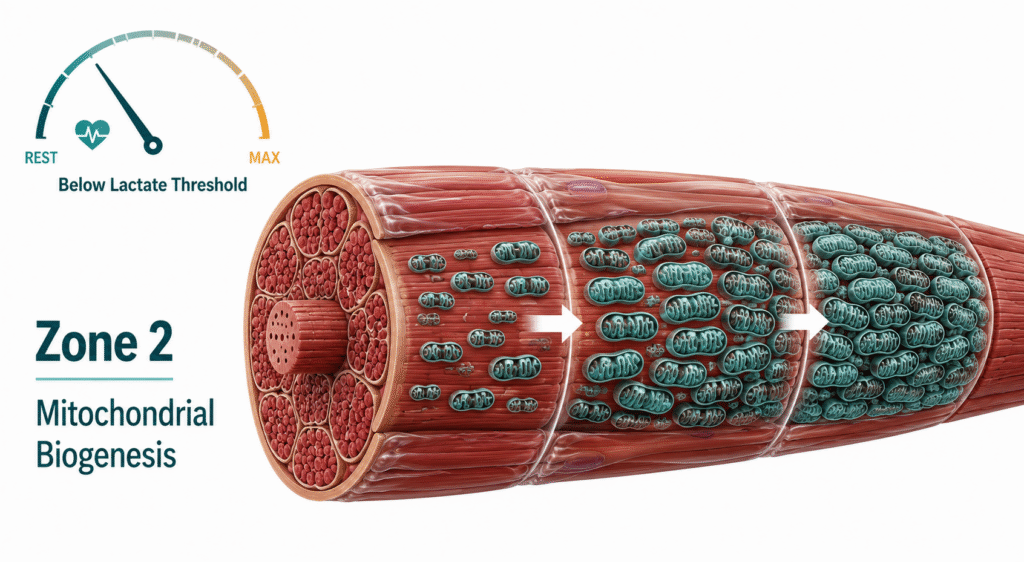
There is a form of exercise that requires no gym membership, no equipment, no special skill, and no recovery day — and it is one of the most effective metabolic interventions available for insulin resistance. It is brisk walking at a pace where you can still hold a conversation, sustained for thirty to sixty minutes, performed consistently across the week. In exercise physiology it is called Zone 2 training. In clinical practice it is the intervention that, more than almost any other single change, begins to restore the metabolic machinery that insulin resistance has degraded.
Zone 2 training is not casual strolling. It is not high-intensity interval training. It sits in a specific intensity band — roughly 60 to 70 percent of maximum heart rate — where fat is the dominant fuel, mitochondria are maximally stimulated, and the metabolic adaptations that matter most for insulin-resistant patients accumulate with every session. It is precisely this intensity band that most people skip entirely, gravitating toward either very light activity that produces minimal adaptation or high-intensity effort that produces different adaptations at a different biological cost.
Understanding why Zone 2 works — and what it does at the cellular level — changes how patients relate to what might otherwise feel like an unremarkable daily walk.
What you will learn: What Zone 2 training is and how to identify it | The mitochondrial and metabolic mechanisms behind its effects | What changes first in clinical practice and on what timeline | Why Zone 2 and resistance training are complementary rather than interchangeable | What a practical Zone 2 protocol looks like for a metabolically compromised patient
What Zone 2 Training Is — and What It Is Not
The exercise intensity spectrum is commonly divided into five zones based on heart rate and metabolic substrate use. Zone 1 is very light activity — a slow walk, gentle movement. Zone 2 is moderate aerobic activity at roughly 60 to 70 percent of maximum heart rate, where fat oxidation is at its peak and lactate production is low. Zones 3 through 5 represent progressively higher intensities where glucose becomes the dominant fuel, lactate accumulates, and the training stimulus shifts from metabolic efficiency to cardiovascular and anaerobic capacity.
Zone 2 is defined physiologically by two characteristics. First, fat is the primary fuel source — mitochondria are oxidizing fatty acids rather than relying predominantly on glycolytic glucose metabolism. Second, lactate remains in a steady state — it is being produced and cleared at roughly equal rates, meaning the effort is sustainable without accumulation of the metabolic byproducts that cause fatigue at higher intensities.
The practical field test is the talk test: you should be able to speak in full sentences during Zone 2 effort, but you would not want to sing. For most deconditioned or insulin-resistant patients, this corresponds to a brisk walk — purposeful, slightly elevated breathing, but not breathless. For fitter individuals the same intensity zone requires a slow jog or cycling. The absolute speed is irrelevant. The metabolic state is what matters.
What Zone 2 is not is equally important to establish. It is not a warm-up. It is not easy enough to be passive or absent-minded movement. And it is not interchangeable with high-intensity interval training. The two modalities activate different cellular pathways, produce different adaptations, and serve different functions in a metabolic recovery protocol. High-intensity training produces superior cardiovascular and anaerobic gains but does not replicate the mitochondrial biogenesis and fat oxidation adaptations that Zone 2 specifically generates.
The Mitochondrial Mechanism: Why This Intensity Band Is Uniquely Effective
The central mechanism behind Zone 2’s metabolic benefits is mitochondrial biogenesis — the creation of new mitochondria within muscle cells, and the improvement of existing mitochondria’s efficiency and oxidative capacity.
Mitochondria are the organelles responsible for producing ATP through oxidative phosphorylation. In metabolically healthy muscle, mitochondria are dense, efficient, and capable of oxidizing both glucose and fat depending on availability and demand. In insulin-resistant muscle, mitochondrial density is reduced, efficiency is impaired, and the capacity to oxidize fat — particularly at rest and at moderate exercise intensities — is significantly diminished. This mitochondrial dysfunction is both a consequence of insulin resistance and a driver of it: impaired fat oxidation leads to intramyocellular lipid accumulation, which directly impairs insulin signaling within the muscle fiber.
Zone 2 training activates PGC-1α — peroxisome proliferator-activated receptor gamma coactivator 1-alpha — the master regulator of mitochondrial biogenesis. PGC-1α activation stimulates the production of new mitochondria, increases the expression of fat oxidation enzymes, and improves the efficiency of the electron transport chain. These adaptations accumulate with repeated Zone 2 sessions over weeks and months, progressively restoring the mitochondrial capacity that insulin resistance has eroded.
The intensity specificity matters. PGC-1α activation through the mitochondrial stress pathway is most robustly triggered at the Zone 2 intensity — where mitochondria are working near their oxidative capacity without being overwhelmed by lactate accumulation or the alternative signaling pathways activated at higher intensities. Training below Zone 2 does not generate sufficient stimulus. Training above Zone 2 shifts the dominant pathway and reduces the relative contribution of mitochondrial fat oxidation adaptations.
This is one of the reasons high-intensity training, while valuable for other purposes, does not substitute for Zone 2 in a metabolic recovery protocol. The adaptations are not the same, and in insulin-resistant patients who are already carrying a cortisol load from metabolic stress, sleep disruption, and life circumstances, the additional cortisol burden of frequent high-intensity training can be counterproductive.
What Changes First: A Clinical Observation Timeline
The sequence of changes that insulin-resistant patients experience when they begin consistent Zone 2 walking is instructive — because it does not follow the sequence most patients expect.
Energy is almost always first. Within two to four weeks of consistent Zone 2 walking alongside a protein-rich whole-food dietary approach, patients frequently report that the chronic post-meal fatigue that characterized their daily experience has diminished. The afternoon energy crash — so common in insulin-resistant patients that many have normalized it as simply how they function — begins to lift. Patients describe it as: “I don’t crash in the afternoon anymore” or “I have more energy throughout the day.” From a physiological standpoint, this reflects early improvements in mitochondrial efficiency and the beginning of restoration of metabolic flexibility — the capacity to access fat as fuel between meals rather than depending entirely on glucose availability.
Postprandial glucose control follows. As mitochondrial function improves and skeletal muscle becomes more efficient at glucose uptake, post-meal glucose excursions typically become smaller and return to baseline more quickly. Patients using continuous glucose monitors frequently notice this improvement before any meaningful change occurs on the scale — which is clinically important because it confirms that metabolic adaptation is occurring independently of weight loss.
The mechanism here overlaps with the acute effects of muscle contraction on GLUT4 translocation described in the posts on skeletal muscle and metabolic health and resistance training and metabolism: regular muscle contraction during walking maintains glucose disposal capacity and insulin sensitivity between formal training sessions.
Fat oxidation improves gradually. Enhanced fat oxidation capacity is better understood as a cumulative adaptation than an immediate outcome. The mitochondrial biogenesis that underlies it develops over weeks to months of consistent training, not days. Patients who expect rapid fat loss from Zone 2 walking often become discouraged when the scale does not move quickly. Reframing Zone 2 as a mitochondrial rebuilding protocol — with fat loss as a downstream consequence of restored metabolic function rather than a direct acute effect — produces better adherence and more accurate expectations.
The metabolic tipping point. One of the most clinically significant observations in practice is what happens around four to eight weeks of consistent Zone 2 training in previously sedentary patients. The first few weeks require conscious effort — walking feels like another obligation on an already full schedule, and the discipline required is real. Then something shifts.
Aerobic capacity improves measurably, breathing becomes easier at the same pace, recovery between sessions accelerates, and the activity begins to feel qualitatively different. Patients stop experiencing walking as exercise and begin experiencing it as part of their routine identity. The most reliable signal is when a patient says: “I actually miss my walk when I don’t do it.” That is the point at which long-term metabolic success becomes structurally likely rather than dependent on ongoing willpower.

Clinical Perspective: What I See in Practice
The pattern I observe consistently is that Zone 2 walking, when introduced alongside a protein-adequate whole-food dietary protocol, produces a quality of metabolic improvement that neither intervention achieves alone. Diet removes the substrate excess driving hyperinsulinemia. Zone 2 training rebuilds the mitochondrial infrastructure that determines what the body does with fuel when insulin is not chronically elevated.
What surprises patients most is the speed of the energy improvement relative to the slowness of the scale change. Most arrive expecting that exercise will produce weight loss first. Instead they experience better energy, clearer thinking, more stable mood, and improved sleep — often within the first two to three weeks — while body weight changes more slowly. I use this sequence deliberately as a clinical teaching moment: the improvements they feel are the metabolic machinery being rebuilt. The weight change follows the machinery, not the other way around.
The patients who respond most slowly are those who add Zone 2 walking on top of chronically poor sleep, high stress loads, and a dietary pattern that keeps insulin elevated throughout the day. Zone 2 training cannot overcome a hormonal environment that is actively suppressing fat oxidation. When fasting insulin remains high from frequent carbohydrate intake and constant eating, the fat oxidation pathway that Zone 2 is attempting to develop remains biochemically blocked regardless of training volume. This is why the dietary and lifestyle context around Zone 2 training determines its effectiveness as much as the training itself.
The patients I find most rewarding to work with are those who were previously athletic — who ran, cycled, or trained regularly in their twenties and thirties and then gradually stopped as life got busier. For these patients, Zone 2 walking reconnects them with a physiological state their body remembers. The tipping point often comes faster for them, and the identity shift from “someone who used to exercise” to “someone who moves daily” happens more readily. The mitochondrial memory is not entirely gone — it needs to be reactivated, not rebuilt from zero.
The myokine dimension of Zone 2 training is also worth noting in practice. As covered in the posts on muscle as an endocrine organ and myokines, sustained moderate-intensity muscle contraction generates the largest IL-6 response of any exercise modality — the anti-inflammatory myokine signal that suppresses TNF-α and IL-1β and reduces the chronic low-grade inflammatory tone that drives insulin resistance. Zone 2 walking is not just a mitochondrial intervention. It is simultaneously an anti-inflammatory one.
Zone 2 and Resistance Training: Complementary, Not Competing
A question that arises consistently in practice is whether Zone 2 training and resistance training compete for the same adaptive resources — the so-called interference effect — or whether they complement each other. For metabolically compromised patients, the answer is unambiguously complementary, because the two modalities target different but mutually reinforcing mechanisms.
Resistance training restores glucose disposal capacity through GLUT4 upregulation, increases muscle mass, and generates the myokine signals that depend on mechanical loading. Its primary metabolic contribution is structural: more muscle, better insulin signaling, greater glucose disposal surface. As detailed in the post on resistance training and metabolism, this structural adaptation is what produces the most durable long-term improvement in insulin sensitivity.
Zone 2 training restores mitochondrial density and fat oxidation capacity — the functional infrastructure that determines what the muscle does with the glucose it disposes of, and how efficiently it switches between fuel sources at rest and during activity. A patient with substantial muscle mass but poor mitochondrial function will have adequate glucose disposal capacity but impaired metabolic flexibility. A patient with good mitochondrial function but low muscle mass will have restored fat oxidation but insufficient glucose disposal capacity. Both are needed.
The practical hierarchy for insulin-resistant patients is resistance training as the primary modality — two to three sessions per week — with Zone 2 walking filling the remaining days. The combination produces superior metabolic outcomes to either modality alone, and the Zone 2 sessions on non-resistance days maintain the continuous muscle contraction stimulus that keeps GLUT4 active and postprandial glucose disposal functioning between formal training sessions.
The relationship between Zone 2 training, mitochondrial adaptation, and the progression of sarcopenia adds a further dimension: patients who walk consistently maintain the type I slow-twitch muscle fibers that Zone 2 specifically recruits, partially offsetting the preferential loss of type II fibers that characterizes age-related muscle decline.
The Practical Protocol
Zone 2 walking for metabolic recovery does not require a heart rate monitor, a treadmill, or a structured program. It requires consistency, correct intensity, and sufficient duration per session.
Intensity: Brisk walking at a pace where conversation is possible but singing is not. Breathing is noticeably elevated but not labored. For most deconditioned insulin-resistant patients, this corresponds to a pace of approximately 5 to 6.5 kilometers per hour on flat ground, though terrain, fitness level, and age all influence the specific pace required to reach Zone 2.
Duration: Thirty to sixty minutes per session is the evidence-supported range for meaningful mitochondrial adaptation. Sessions shorter than twenty minutes produce limited PGC-1α stimulus. Sessions of forty-five to sixty minutes produce the most robust mitochondrial biogenesis response in the research literature.
Frequency: Four to five sessions per week produces superior mitochondrial adaptation to two to three sessions. Daily Zone 2 walking is achievable for most patients because the intensity does not require recovery time in the way that resistance training or high-intensity work does.
Progression: As fitness improves over weeks, the pace required to maintain Zone 2 intensity increases. A patient who reaches Zone 2 at 5 kilometers per hour in week one may need 6.5 kilometers per hour to achieve the same metabolic state in week eight. This is a marker of adaptation, not a problem — it means the mitochondrial rebuilding is working.
Context: Zone 2 walking performed in a fasted state or in the two to three hours following a protein-rich meal produces the strongest fat oxidation stimulus. Walking immediately after a high-carbohydrate meal in a hyperinsulinemic patient shifts the dominant fuel toward glucose and partially blunts the fat oxidation adaptation.

The Animal-Based Protocol for Insulin Resistance and Type 2 Diabetes
A Functional Medicine Framework
A Note on Uncertainty
The Zone 2 research base is robust for trained athletes and increasingly well-documented for metabolic disease populations, but precise dose-response relationships — the optimal session duration, weekly volume, and intensity boundaries for insulin-resistant patients specifically — are still being refined. Most of the landmark mechanistic work on PGC-1α and mitochondrial biogenesis comes from exercise physiology research in trained populations. Translation to deconditioned and metabolically compromised patients is supported by clinical observation and a growing body of intervention studies but is not yet as precisely characterized as the resistance training literature. The directional evidence is consistent: Zone 2 training at the intensities and frequencies described above improves mitochondrial function, fat oxidation capacity, and insulin sensitivity in metabolically compromised individuals.
People Also Ask
What is Zone 2 training?
Zone 2 training is moderate-intensity aerobic exercise at roughly 60 to 70 percent of maximum heart rate, where fat is the primary fuel source and lactate remains in a steady state. It is the intensity band that most robustly stimulates mitochondrial biogenesis and fat oxidation adaptation. For most deconditioned patients it corresponds to brisk walking.
Why is Zone 2 training good for insulin resistance?
Zone 2 training stimulates mitochondrial biogenesis through PGC-1α activation, restoring the mitochondrial density and fat oxidation capacity that insulin resistance degrades. It improves postprandial glucose disposal through sustained muscle contraction, generates anti-inflammatory myokine signals, and restores metabolic flexibility — the ability to shift between glucose and fat as fuel sources.
How do I know if I am in Zone 2?
Use the talk test: you should be able to speak in full sentences but would not want to sing. Breathing is noticeably elevated but not labored. You could sustain the effort for forty-five to sixty minutes without stopping. If you can converse easily without any elevated breathing, you are below Zone 2. If you cannot speak in full sentences, you are above it.
How long does it take to see results from Zone 2 training?
Energy improvements and better postprandial glucose control typically appear within two to four weeks of consistent practice. Meaningful mitochondrial adaptation — improved fat oxidation, metabolic flexibility, and cardiovascular efficiency — develops over eight to twelve weeks. The full benefit of consistent Zone 2 training on insulin sensitivity and body composition accumulates over months.
Can Zone 2 walking replace resistance training for metabolic health?
No. The two modalities target different mechanisms. Resistance training increases muscle mass and GLUT4 expression — the structural glucose disposal capacity. Zone 2 training restores mitochondrial density and fat oxidation — the functional metabolic flexibility. Both are needed for comprehensive metabolic recovery. Zone 2 walking complements resistance training; it does not substitute for it.
How many days per week should I do Zone 2 training?
Four to five sessions per week produces the strongest mitochondrial adaptation. Unlike resistance training, Zone 2 walking does not require recovery days, making daily practice feasible for most patients. Session duration of forty-five to sixty minutes produces the most robust PGC-1α stimulus.
Is Zone 2 training the same as HIIT?
No. HIIT and Zone 2 activate different cellular pathways and produce different adaptations. HIIT produces superior cardiovascular and anaerobic adaptations but does not replicate the mitochondrial fat oxidation adaptations that Zone 2 specifically generates. For insulin-resistant patients carrying metabolic stress and often elevated cortisol, frequent HIIT can add to the cortisol load rather than supporting recovery.
About the Author
Morteza Ariana is a State-Certified Functional Nutritionist based in Germany, specializing in insulin resistance, type 2 diabetes, and root-cause metabolic restoration. He holds advanced training in systems-based physiology and has worked with patients across the U.S. and Europe for over 10 years.
His clinical framework is built around a core principle that mainstream medicine consistently overlooks: chronically elevated insulin — not blood glucose — is the earliest and most actionable driver of metabolic disease. That conviction was shaped in part by his own experience with hyperinsulinemia in 2016, and deepened through a decade of clinical practice and the study of leading researchers in metabolic medicine including Benjamin Bikman, Joseph Kraft, Gerald Reaven, Jason Fung, and Stephen Phinney.
His work focuses on identifying and correcting the upstream metabolic signals — insulin load, liver-gut axis dysfunction, circadian misalignment, and micronutrient gaps — that standard screening misses entirely. Patient outcomes are documented, anonymized, and published on this site.
If this resonates, the next step is clarity
The Metabolic Restoration Blueprint is a structured 12-week framework designed to correct upstream metabolic drivers — not just manage symptoms.
Scientific References
Mann S, Beedie C, Jimenez A. Differential effects of aerobic exercise, resistance training and combined exercise modalities on cholesterol and the lipid profile. Sports Med. 2014;44(2):211–221. 🔗 https://pubmed.ncbi.nlm.nih.gov/24174305/
Holloszy JO, Coyle EF. Adaptations of skeletal muscle to endurance exercise and their metabolic consequences. J Appl Physiol. 1984;56(4):831–838. 🔗 https://pubmed.ncbi.nlm.nih.gov/6373687/
Booth FW, Roberts CK, Laye MJ. Lack of exercise is a major cause of chronic diseases. Compr Physiol. 2012;2(2):1143–1211. 🔗 https://pubmed.ncbi.nlm.nih.gov/23798295/
Hawley JA, Lessard SJ. Exercise training-induced improvements in insulin action. Acta Physiol. 2008;192(1):127–135. 🔗 https://pubmed.ncbi.nlm.nih.gov/18171429/
Irrcher I, Adhihetty PJ, Joseph AM, et al. Regulation of mitochondrial biogenesis in muscle by endurance exercise. Sports Med. 2003;33(11):783–793. 🔗 https://pubmed.ncbi.nlm.nih.gov/12959619/
Menshikova EV, Ritov VB, Fairfull L, et al. Effects of exercise on mitochondrial content and function in aging human skeletal muscle. J Gerontol A Biol Sci Med Sci. 2006;61(6):534–540. 🔗 https://pubmed.ncbi.nlm.nih.gov/16799133/
Goodpaster BH, Sparks LM. Metabolic flexibility in health and disease. Cell Metab. 2017;25(5):1027–1036. 🔗 https://pubmed.ncbi.nlm.nih.gov/28467930/
Richter EA, Hargreaves M. Exercise, GLUT4, and skeletal muscle glucose uptake. Physiol Rev. 2013;93(3):993–1017. 🔗 https://pubmed.ncbi.nlm.nih.gov/23899560/
Pedersen BK, Febbraio MA. Muscles, exercise and obesity: skeletal muscle as a secretory organ. Nat Rev Endocrinol. 2012;8(8):457–465. 🔗 https://pubmed.ncbi.nlm.nih.gov/22473333/
Seiler S. What is best practice for training intensity and duration distribution in endurance athletes? Int J Sports Physiol Perform. 2010;5(3):276–291. 🔗 https://pubmed.ncbi.nlm.nih.gov/20861519/
Coggan AR, Raguso CA, Gastaldelli A, et al. Fat metabolism during high-intensity exercise in endurance-trained and untrained men. Metabolism. 2000;49(1):122–128. 🔗 https://pubmed.ncbi.nlm.nih.gov/10647077/
Lanza IR, Sreekumaran Nair K. Muscle mitochondrial changes with aging and exercise. Am J Clin Nutr. 2009;89(1):467S–471S. 🔗 https://pubmed.ncbi.nlm.nih.gov/19118214/
Finck BN, Kelly DP. PGC-1 coactivators: inducible regulators of energy metabolism in health and disease. J Clin Invest. 2006;116(3):615–622. 🔗 https://pubmed.ncbi.nlm.nih.gov/16511594/
Ingelsson E, Sullivan LM, Murabito JM, et al. Prevalence and prognostic impact of suboptimal exercise capacity. Eur Heart J. 2006;27(9):1049–1056. 🔗 https://pubmed.ncbi.nlm.nih.gov/16569653/