
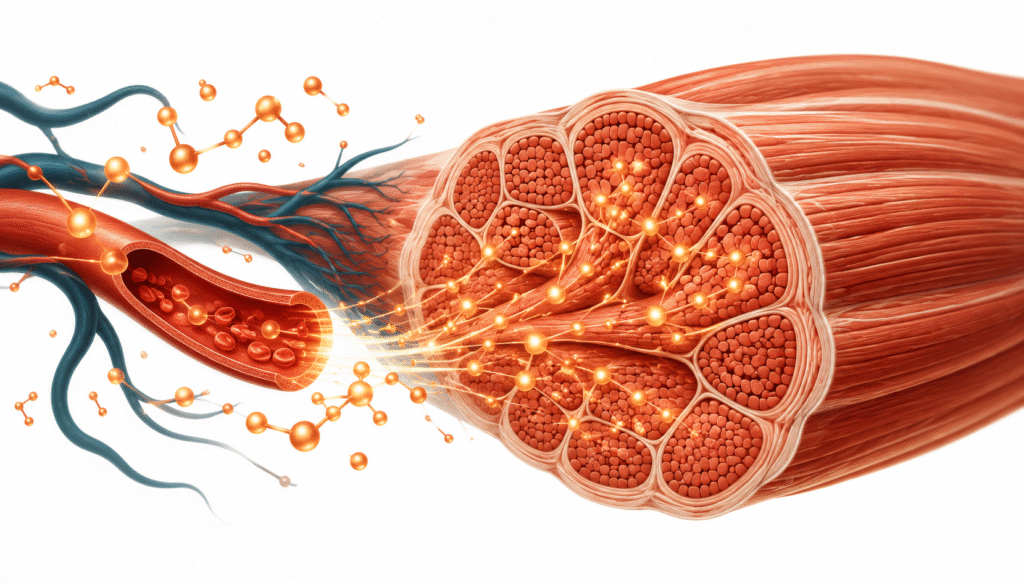
The connection between skeletal muscle and metabolic health is one of the most underappreciated relationships in clinical medicine. Far from being just the tissue that moves your body, skeletal muscle is your largest glucose-disposal organ — and its condition determines, more than almost any other factor, how your metabolism functions today and how it will age.
Why Skeletal Muscle and Metabolic Health Are Inseparable
Skeletal muscle is not just the tissue that moves your body. It is the largest metabolically active organ you have, and it plays a more decisive role in your long-term metabolic health than almost any other biological system. Yet in standard clinical practice — and in most nutrition and fitness conversations — muscle is discussed primarily in terms of aesthetics or physical performance. The metabolic function of muscle rarely enters the conversation at all.
That is a significant clinical gap. Because when insulin resistance develops, when triglycerides rise, when fasting glucose begins to drift, when energy declines and fat accumulates in the liver and around the viscera, skeletal muscle is almost always part of the story. Not as a bystander — as a central driver.
This post examines why muscle is the body’s most important metabolic organ, what happens to metabolism when muscle mass declines or becomes metabolically inactive, and why rebuilding skeletal muscle is not exercise advice — it is one of the most evidence-based interventions available for reversing insulin resistance at its root.
What you will learn:
Why skeletal muscle is the primary site of glucose disposal after a meal | How muscle loss and disuse drive the progression from compensatory hyperinsulinemia to full metabolic syndrome | What myokines are and why muscle functions as an endocrine organ | Why sarcopenia is a metabolic disease, not just a consequence of aging | How resistance training and metabolic flexibility interact | What the practical protocol looks like for rebuilding metabolic function through muscle
Skeletal Muscle Is the Body’s Largest Glucose Sink
After a meal, the body must clear a substantial glucose load from circulation. The liver handles a portion of that clearance, but skeletal muscle is responsible for disposing of the majority — estimates consistently place skeletal muscle’s contribution at 75 to 85 percent of postprandial glucose uptake under insulin-stimulated conditions. No other tissue comes close to that capacity.
The mechanism is straightforward at its core. Insulin binds to receptors on the muscle cell membrane, triggering a signaling cascade that drives GLUT4 transporter proteins to the cell surface. Those transporters then pull glucose into the muscle cell, where it is either oxidized for energy or stored as glycogen. When that process works as designed, blood glucose and insulin both return to baseline relatively quickly after a meal. The system is efficient, responsive, and self-limiting.
When muscle mass decreases — through aging, sedentary behavior, chronic disuse, or repeated dieting without strength building — that glucose disposal capacity shrinks proportionally. Less muscle surface area means fewer GLUT4 translocation sites. Fewer translocation sites means slower glucose clearance. Slower glucose clearance means the pancreas must produce more insulin to achieve the same result.
This is the upstream event that most metabolic patients never hear about from their GP. The first laboratory abnormality in the progression toward type 2 diabetes is not elevated fasting glucose. It is elevated fasting insulin — the pancreas compensating for declining muscle-mediated glucose disposal by working harder. As detailed in the post on hyperinsulinemia, this compensatory phase can persist silently for a decade or more before glucose begins to drift. The glucose dysregulation that eventually shows up on a standard panel is a late signal. The muscle dysfunction that preceded it is the earlier and more actionable one.
Muscle as an Endocrine Organ: The Myokine Story
The metabolic role of skeletal muscle extends well beyond glucose disposal. Over the past two decades, research has established that contracting muscle tissue secretes a broad family of signaling proteins called myokines — cytokines produced and released by muscle fibers in response to contraction. These myokines act locally, regionally, and systemically, making skeletal muscle a genuine endocrine organ with wide-reaching effects on metabolism, inflammation, and organ function.
The most studied myokine is interleukin-6 (IL-6), which under conditions of muscle contraction acts as an anti-inflammatory metabolic signal — stimulating fat oxidation, improving insulin sensitivity in peripheral tissues, and suppressing the production of pro-inflammatory cytokines including TNF-α. This is notable because IL-6 produced by adipose tissue in the context of obesity and metabolic dysfunction acts as a pro-inflammatory signal. The same molecule has opposing effects depending on whether it originates from contracting muscle or from inflamed fat. The distinction is lost when muscle is inactive.
Irisin is another myokine of significant clinical relevance. Released during resistance exercise, irisin promotes the browning of white adipose tissue — converting metabolically inert fat storage cells into more thermogenically active cells that dissipate energy as heat. It also has documented effects on bone mineral density, neuronal plasticity, and insulin sensitivity. Sedentary muscle produces very little irisin. Active, contracting muscle produces it in proportion to mechanical load.
BDNF (brain-derived neurotrophic factor), IGF-1, FGF-21, and myonectin are among the other myokines now recognized to mediate communication between muscle and the liver, pancreas, bone, brain, and adipose tissue. The picture that emerges is not of an isolated contractile organ but of a deeply integrated signaling hub. For a detailed examination of this signaling system, see Muscle as an Endocrine Organ: The Signaling System Your Doctor Has Never Discussed.
When muscle contracts regularly and under sufficient load, it broadcasts metabolic signals that benefit virtually every other organ system. When it does not — when it atrophies from disuse or aging — those signals go quiet. The systemic metabolic consequences of that silence are substantial.
For a deeper look at the individual myokines and their clinical significance, see Myokines: The Molecular Language Your Muscles Speak.
Clinical Perspective: What I See in Practice
One of the most consistent patterns I observe is that insulin resistance is rarely just a glucose problem. It is an energy-partitioning problem, and skeletal muscle sits at the center of that equation.
When patients present with elevated fasting insulin, a high triglyceride-to-HDL ratio, increasing waist circumference, post-meal fatigue, and sluggish glucose control, their history almost always includes some combination of progressive muscle loss, sedentary work with prolonged sitting, little or no resistance training, previous athletic activity that gradually disappeared, chronic stress and poor sleep, and repeated cycles of dieting without strength building.
The story I hear most frequently runs something like this: “I used to be active ten or twenty years ago, but life got busy, I stopped training, gained weight slowly, and my energy gradually declined.” From a physiological standpoint, that narrative is a precise description of what happens when the body’s primary glucose disposal organ is progressively underloaded and undermaintained.
What is particularly striking in clinical practice is that the severity of metabolic dysfunction often correlates more closely with muscle quality than with body weight alone. I have seen lean individuals with low muscle mass and severe insulin resistance, and larger individuals with substantial muscle mass and surprisingly intact metabolic markers. This is one of the clearest demonstrations of why BMI is such a poor clinical tool — two patients at the same weight can have dramatically different metabolic futures depending on how much of that weight is functional muscle versus stored fat.
The patients with the worst insulin resistance frequently exhibit what I have come to call metabolic fragility: low relative muscle mass, poor strength, minimal daily movement, reduced mitochondrial capacity, and fat accumulation in the liver and visceral compartment simultaneously. That combination is particularly dangerous because inactivity itself induces insulin resistance — even a few days of dramatically reduced movement can measurably decrease insulin sensitivity in otherwise healthy individuals.
In practice, when I evaluate an insulin-resistant patient, I am as interested in questions like how strong are they, how much muscle have they lost over the last decade, when did they stop resistance training, and how many hours do they sit daily, as I am in their laboratory values. The laboratory numbers tell me where they are today. Their muscle history frequently tells me how they got there.

Sarcopenia Is a Metabolic Disease
Sarcopenia — the progressive loss of skeletal muscle mass and function with aging — is classified in most clinical settings as a geriatric syndrome and addressed, when it is addressed at all, through fall prevention and physical therapy. That framing misses the metabolic dimension entirely.
Age-related muscle loss begins earlier than most patients expect. Research consistently documents measurable decline in muscle mass from the fourth decade onward, accelerating after 60 in the absence of deliberate intervention. The rate of loss is not fixed — it is heavily influenced by hormonal status, protein intake, physical activity, sleep quality, and metabolic health. But the direction is consistent: without specific counter-pressure, muscle mass decreases across the lifespan.
Each kilogram of muscle lost represents a meaningful reduction in the body’s glucose disposal capacity. In a patient who has already developed insulin resistance — whose peripheral insulin signaling is already impaired — ongoing muscle loss accelerates the progression toward beta cell exhaustion and frank type 2 diabetes. Sarcopenia and insulin resistance are not independent processes. They amplify each other. Insulin resistance impairs the anabolic signaling that would otherwise preserve muscle mass. Muscle loss further reduces insulin sensitivity. The bidirectional relationship is a self-reinforcing cycle that standard care almost never interrupts because it almost never identifies it.
The connection between sarcopenia and fatty liver adds a further dimension. As explored in the post on insulin resistance and fatty liver, reduced muscle glucose uptake increases the substrate load diverted to hepatic de novo lipogenesis. Less glucose cleared by muscle means more glucose available for liver fat synthesis. Sarcopenic patients frequently present with NAFLD at body weights that would not conventionally trigger a fatty liver workup. The muscle loss is the missing variable.
For a full examination of sarcopenia as a metabolic disease and the intervention protocol, see Sarcopenia: Why Losing Muscle Is a Metabolic Emergency, Not a Normal Part of Aging.
Resistance Training Is a Metabolic Intervention
The practical implication of everything above is that resistance training is not exercise advice in the conventional sense. It is a targeted metabolic intervention that addresses the upstream biology of insulin resistance directly — increasing GLUT4 expression, expanding the glucose disposal surface, stimulating myokine production, improving mitochondrial density, and preserving the muscle mass that sarcopenia would otherwise erode.
The acute effect of a resistance training session on insulin sensitivity is measurable and clinically significant. A single bout of resistance exercise increases GLUT4 translocation to the muscle cell surface through insulin-independent pathways — primarily via AMPK activation — meaning that glucose uptake is enhanced for 24 to 48 hours following training independent of any change in insulin levels. This is the mechanism behind the post-exercise glucose-lowering effect that patients with type 2 diabetes observe even on the day of training.
The chronic adaptation to consistent resistance training is more substantial. Regular mechanical loading increases GLUT4 protein expression within the muscle fiber, increases mitochondrial density, improves the efficiency of insulin signaling through IRS-1 and PI3K pathways, and increases the physical cross-sectional area of muscle available for glucose uptake. These adaptations develop over weeks to months and represent a genuine structural improvement in metabolic function — not a temporary effect.
Zone 2 aerobic training — steady-state low-intensity exercise at roughly 60 to 70 percent of maximum heart rate, where fat is the dominant fuel and conversation is still possible — complements resistance training through a distinct mechanism. Zone 2 specifically develops mitochondrial density and improves the capacity of muscle to oxidize fat at rest, which is the operational definition of metabolic flexibility. A metabolically flexible patient can shift efficiently between glucose and fat as fuel depending on availability and demand.
A metabolically inflexible patient — one whose mitochondria are sparse, whose muscle is insulin resistant, and whose fasting insulin is chronically elevated — is largely stuck burning glucose, cannot access fat stores effectively, and experiences the fatigue and hunger cycling that characterizes metabolic dysfunction in clinical practice.
Chronic high-intensity cardio without adequate recovery, by contrast, can elevate cortisol to a degree that impairs insulin sensitivity and promotes muscle catabolism — counterproductive in a population that already has insufficient muscle mass. The relationship between exercise type, cortisol, and metabolic adaptation is nuanced, but the clinical hierarchy is consistent: resistance training first, Zone 2 second, high-intensity work reserved for patients with adequate recovery capacity and sufficient muscle mass to absorb the training load.
For the full clinical case and marker timeline, see Resistance Training and Metabolism: The Most Underused Clinical Intervention in Insulin Resistance.
Protein: The Non-Negotiable Input
Muscle cannot be built or maintained without adequate dietary protein. This statement is less obvious to patients than it should be, because decades of low-fat dietary guidance created a clinical culture in which fat was feared, carbohydrates were permitted, and protein — particularly animal protein — was either ignored or actively discouraged.
The functional threshold for muscle protein synthesis in adults is a leucine content per meal sufficient to trigger the mTOR signaling pathway — approximately 2.5 to 3 grams of leucine per meal, which corresponds to roughly 30 to 40 grams of high-quality animal protein. Below that threshold, muscle protein synthesis is not optimally stimulated regardless of total daily protein intake. The distribution of protein across meals matters, not just the daily total.
The practical target of 1.6 grams of protein per kilogram of ideal body weight per day — distributed across meals rather than concentrated in one — reflects the current evidence base for muscle preservation and synthesis in adults managing insulin resistance. Animal-based sources are prioritized because of their leucine density, digestibility, and complete amino acid profile. The post on how to improve insulin sensitivity with muscle covers the practical protein strategy in detail.
The fear of dietary protein — and particularly the conflation of high protein intake with kidney damage in metabolically healthy individuals — is not supported by the evidence and represents one of the more consequential pieces of nutritional misinformation that insulin-resistant patients frequently arrive carrying.
A Note on Uncertainty
The science of myokines is developing rapidly, and the full signaling map of contracting muscle is not yet complete. Specific myokine thresholds, dose-response relationships between training volume and metabolic adaptation, and the precise contribution of mitochondrial biogenesis to clinical outcomes in insulin-resistant populations are active areas of research. Individual responses to resistance training and Zone 2 protocols vary meaningfully based on hormonal status, sleep quality, protein intake, and baseline metabolic health. The framework above reflects the current evidence base and my clinical observations — it should be read as a working model, not a fixed certainty.

The Animal-Based Protocol for Insulin Resistance and Type 2 Diabetes
A Functional Medicine Framework
Practical Implications
The clinical sequence that follows from this framework is direct. Assess muscle mass and strength early — not as an afterthought but as a primary metabolic marker alongside fasting insulin, HOMA-IR, TG/HDL ratio, and liver enzymes. Ask the movement history. Understand how much functional muscle the patient has lost and over what timeframe.
Prioritize protein at 1.6 grams per kilogram of ideal body weight, distributed across meals, from animal-based sources, before manipulating carbohydrates or installing fasting protocols. Muscle protein synthesis requires adequate substrate. A patient who is fasting aggressively while eating insufficient protein is not building the metabolic infrastructure that will sustain long-term insulin sensitivity.
Introduce resistance training as the primary exercise modality — two to three sessions per week, progressing load over time, with an emphasis on compound movements that recruit large muscle groups. Add Zone 2 aerobic work to develop mitochondrial density and fat oxidation capacity. Avoid prescribing chronic high-intensity cardio in patients who are already cortisol-loaded, sleep-deprived, or carrying insufficient muscle mass.
Monitor markers over 8 to 12 weeks. Fasting insulin, HOMA-IR, and TG/HDL ratio are the most sensitive early indicators of improving muscle-mediated glucose disposal. Body composition changes often lag laboratory improvements — expect the markers to move first.
For patients who want to begin immediately with a structured nutritional framework while the training adaptation develops, The Animal-Based Protocol for Insulin Resistance → provides the dietary foundation that makes resistance training metabolically productive.
People Also Ask
Is skeletal muscle really the most important organ for metabolic health?
By volume of glucose disposal, insulin signaling surface area, and endocrine function via myokines, skeletal muscle has the strongest claim to that title of any organ outside the pancreas and liver. Its contribution to postprandial glucose clearance alone — 75 to 85 percent under insulin-stimulated conditions — makes it the primary determinant of how well or poorly the metabolic system handles a meal.
What happens to insulin resistance when muscle mass decreases?
Insulin resistance worsens. Less muscle mass means fewer GLUT4 translocation sites, slower glucose clearance, and greater compensatory insulin demand from the pancreas. The progression from compensatory hyperinsulinemia to frank type 2 diabetes is significantly accelerated by ongoing muscle loss.
What are myokines and why do they matter for metabolism?
Myokines are signaling proteins secreted by contracting muscle tissue. They act on the liver, adipose tissue, pancreas, brain, and bone — improving insulin sensitivity, promoting fat oxidation, reducing inflammation, and stimulating mitochondrial biogenesis. Sedentary muscle produces very few myokines. Active muscle produces them in proportion to mechanical load.
What is the difference between sarcopenia and normal aging?
Sarcopenia is the clinically significant, accelerated loss of muscle mass and function that exceeds normal age-related change. It is driven by insufficient protein intake, physical inactivity, hormonal decline, and metabolic dysfunction — and it is not inevitable. It is modifiable with resistance training and adequate protein, even in older adults.
How much protein do I need to preserve muscle mass with insulin resistance?
The evidence-based minimum for adults managing insulin resistance is 1.6 grams per kilogram of ideal body weight per day, distributed across meals at a threshold sufficient to trigger muscle protein synthesis — approximately 30 to 40 grams of animal-based protein per meal. Total daily intake matters less than the distribution and quality of protein at each meal.
Does Zone 2 training actually improve insulin sensitivity?
Yes, through mitochondrial biogenesis rather than through the GLUT4 mechanism that resistance training activates. Zone 2 training increases the density and efficiency of mitochondria within muscle fibers, improving the capacity to oxidize fat and reducing reliance on glycolytic glucose metabolism. The two modalities are complementary, not interchangeable.
Can you reverse insulin resistance without medication through muscle-focused intervention?
The evidence base supports significant and clinically meaningful reversal of insulin resistance through resistance training, Zone 2 aerobic training, adequate protein intake, and removal of the dietary inputs that drive hyperinsulinemia. Medication is not a prerequisite for metabolic improvement in the majority of cases — it is a tool that may support the process in specific situations, always in collaboration with the patient’s physician.
About the Author
Morteza Ariana is a State-Certified Functional Nutritionist based in Germany, specializing in insulin resistance, type 2 diabetes, and root-cause metabolic restoration. He holds advanced training in systems-based physiology and has worked with patients across the U.S. and Europe for over 10 years.
His clinical framework is built around a core principle that mainstream medicine consistently overlooks: chronically elevated insulin — not blood glucose — is the earliest and most actionable driver of metabolic disease. That conviction was shaped in part by his own experience with hyperinsulinemia in 2016, and deepened through a decade of clinical practice and the study of leading researchers in metabolic medicine including Benjamin Bikman, Joseph Kraft, Gerald Reaven, Jason Fung, and Stephen Phinney.
His work focuses on identifying and correcting the upstream metabolic signals — insulin load, liver-gut axis dysfunction, circadian misalignment, and micronutrient gaps — that standard screening misses entirely. Patient outcomes are documented, anonymized, and published on this site.
If this resonates, the next step is clarity
The Metabolic Restoration Blueprint is a structured 12-week framework designed to correct upstream metabolic drivers — not just manage symptoms.
Scientific References
Metter EJ, Talbot LA, Schrager M, Conwit R. Skeletal muscle strength as a predictor of all-cause mortality in healthy men. J Gerontol A Biol Sci Med Sci. 2002;57(10):B359–B365. 🔗 https://pubmed.ncbi.nlm.nih.gov/12242311/
DeFronzo RA, Tripathy D. Skeletal muscle insulin resistance is the primary defect in type 2 diabetes. Diabetes Care. 2009;32(Suppl 2):S157–S163. 🔗 https://pubmed.ncbi.nlm.nih.gov/19875544/
Pedersen BK, Febbraio MA. Muscles, exercise and obesity: skeletal muscle as a secretory organ. Nat Rev Endocrinol. 2012;8(8):457–465. 🔗 https://pubmed.ncbi.nlm.nih.gov/22473333/
Boström P, Wu J, Jedrychowski MP, et al. A PGC1-α-dependent myokine that drives brown-fat-like development of white fat and thermogenesis. Nature. 2012;481(7382):463–468. 🔗 https://pubmed.ncbi.nlm.nih.gov/22237023/
Egan B, Zierath JR. Exercise metabolism and the molecular regulation of skeletal muscle adaptation. Cell Metab. 2013;17(2):162–184. 🔗 https://pubmed.ncbi.nlm.nih.gov/23395166/
Holloszy JO. Exercise-induced increase in muscle insulin sensitivity. J Appl Physiol. 2005;99(1):338–343. 🔗 https://pubmed.ncbi.nlm.nih.gov/16036907/
Richter EA, Hargreaves M. Exercise, GLUT4, and skeletal muscle glucose uptake. Physiol Rev. 2013;93(3):993–1017. 🔗 https://pubmed.ncbi.nlm.nih.gov/23899560/
Cruz-Jentoft AJ, Bahat G, Bauer J, et al. Sarcopenia: revised European consensus on definition and diagnosis. Age Ageing. 2019;48(1):16–31. 🔗 https://pubmed.ncbi.nlm.nih.gov/30312372/
Goodpaster BH, Sparks LM. Metabolic flexibility in health and disease. Cell Metab. 2017;25(5):1027–1036. 🔗 https://pubmed.ncbi.nlm.nih.gov/28467930/
Lanza IR, Sreekumaran Nair K. Muscle mitochondrial changes with aging and exercise. Am J Clin Nutr. 2009;89(1):467S–471S. 🔗 https://pubmed.ncbi.nlm.nih.gov/19118214/
Wolfe RR. The underappreciated role of muscle in health and disease. Am J Clin Nutr. 2006;84(3):475–482. 🔗 https://pubmed.ncbi.nlm.nih.gov/16960159/
Bikman BT. Why We Get Sick. BenBella Books, 2020. Clinical framework for hyperinsulinemia as upstream driver.
Lexell J. Human aging, muscle mass, and fiber type composition. J Gerontol A Biol Sci Med Sci. 1995;50 Spec No:11–16. 🔗 https://pubmed.ncbi.nlm.nih.gov/7493202/
Morton RW, Murphy KT, McKellar SR, et al. A systematic review, meta-analysis and meta-regression of the effect of protein supplementation on resistance training-induced gains in muscle mass and strength. Br J Sports Med. 2018;52(6):376–384. 🔗 https://pubmed.ncbi.nlm.nih.gov/28698222/